Topic 1 – The Case for Making the Best of Limited Safety Data on Biking & Walking
The Benchmarking Report discusses bicycling and walking safety, not general road safety. Bicycling and walking safety is a lens for general road safety because people who bike and walk are some of the most vulnerable road users, and people who bike and walk generally do not get prominent discussion in traditional road safety reporting, despite the increasing share of fatalities they represent.
Let’s examine three principal metrics for road safety for bicyclists and pedestrians: 1) percentage of traffic fatalities by mode, 2) modal traffic fatalities per 100,000 persons, and 3) modal traffic fatalities per 10,000 commuters. The Benchmarking Report uses the word modal as a general term for mode of transportation and to indicate that a metric could be used for any mode of transportation. Each metric is discussed for slightly different reasons:
MODAL PERCENTAGE OF TRAFFIC FATALITIES
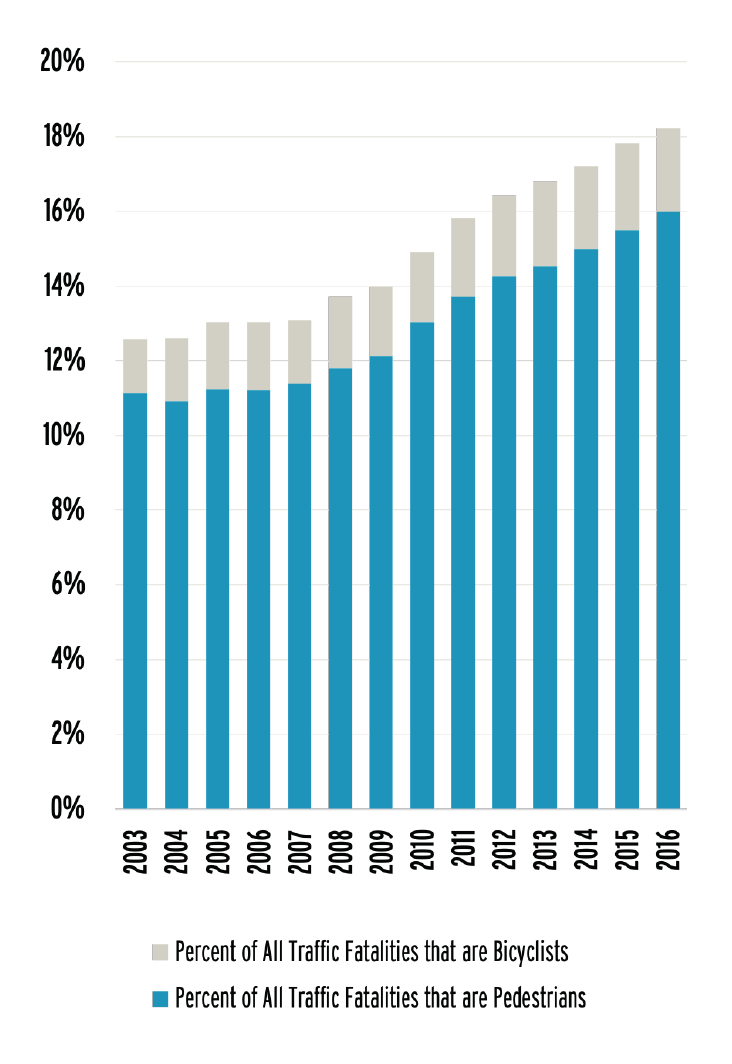
This metric looks at the percentage of traffic fatalities made up of people who used a particular mode of transportation. In recent years, a notable trend has emerged: People who are bicycling and walking represent an increasing percentage of all traffic fatalities.
This increase is primarily due to pedestrian fatalities, although the raw numbers of both bicyclist and pedestrian fatalities have increased in recent years. In 2016, 835 bicyclist fatalities occurred in the United States, the most since 1991, when there were 836 bicyclist fatalities. 25 Similarly, 5,987 pedestrians were killed in 2016, the most since 1990 and its 6,482 pedestrian fatalities.
MODAL TRAFFIC FATALITIES PER 100,000 PERSONS
The Benchmarking Report includes per capita fatality data to allow comparisons among states and communities that have different populations.
Per capita comparisons can be very effective for prompting action. For example, the National Complete Streets Coalition’s “Dangerous by Design” reports have identified communities with high rates of pedestrian fatalities by using a mix of per capita and per commuter data, which built the case for action in communities with ongoing problems. 26
Per capita data are also very common in public health research. The Centers for Disease Control and Prevention’s Web-based Injury Statistics Query and Reporting System (WISQARS) database includes per capita fatality and serious injury estimates by default. 27
Expressed per capita, people are much more likely to die in a car crash than as a bicyclist or pedestrian. The rate of pedestrian fatalities per 100,000 persons is approximately 1.8. 28 The rate of bicyclist fatalities per 100,000 persons is approximately 0.26. 29 The rate of traffic fatalities per 100,000 persons for passenger vehicles is 7.6–nearly four times the rate of pedestrian traffic fatalities and more than 28 times the rate of bicyclist traffic fatalities. 30 However, the lack of information on walking and biking in per capita estimates makes interpretation of these risks difficult.
MODAL TRAFFIC FATALITIES PER 10,000 COMMUTERS
For passenger vehicle travel, safety statistics frequently include a denominator that shows the distance traveled to provide an indicator of how likely a person is to die per mile driven rather than based on a population rate. This is often presented as motor vehicle fatalities per 100 million vehicle miles traveled (VMT). 31 In traffic safety discussions around autos, VMT may be called “exposure” because it quantifies a person’s risk when exposed to a mile of vehicle travel.
VMT is limited when discussing traffic safety in the context of public health because health outcomes can appear to improve as VMT increases, and vehicle driving has inherent risks of its own. For example, in 2008, the rate of fatalities per 100 million VMT was 1.26 (37,423 people died in traffic fatalities). 32 In 2016, the rate was 1.18 (37,461 people died in traffic fatalities). 33 Despite an increase of 38 deaths, an agency or decision maker looking at fatalities per VMT would find a 6% improvement in traffic safety. Regardless, the number of fatalities per VMT is a prominent safety statistic because it helps people understand relative risks when comparing cities, states, or other jurisdictions.
The limited utility of fatalities per VMT was well stated by Frank Haight, the founding editor of the journals Transportation Research and Accident Analysis and Prevention 34 , in a 1985 report: “We do not measure the public health hazard by the fatality rate per distance traveled, a quantity much used in traffic engineering. This ratio is irrelevant to the public health question, just as it might be if we measured lung cancer per quantity of cigarettes consumed, or malaria per mosquito. The similarity is not that mobility and smoking are socially equivalent, but that the vehicle-mile fatality rate, like the per cigarette cancer rate, would confuse cause with effect.” 35
For biking and walking, no equivalent statistic of vehicle or person miles traveled is readily available at a sub- national level. Roughly once a decade the miles traveled by walking and biking are estimated by the National Household Travel Survey. 36 Recently, several states have undertaken or sponsored research projects to create bicycle and/or pedestrian miles traveled estimates for their states, including Washington 37 and Minnesota. 38 Developing a miles-traveled metric for bicycling and walking is also part of Oregon’s Bicycle and Pedestrian Master Plan. 39
In the absence of a miles traveled estimate, bicycling and walking commuter (journey to work) data provide a denominator that is useful for highlighting the relative risks of biking and walking in different localities. Use of commuter data has several advantages over use of only the number of pedestrian or bicyclist fatalities, their percentage of all traffic fatalities, or a per capita rate. Most important is that it accounts for differences in the likelihood of people riding or walking in a state or community, which provides additional insights into the relative risks of bicycling and walking between places in the United States. Considerable differences are found in the rates of bicycling and walking among communities throughout the United States, and in some places, these differences have persisted over time. Without using commuter data, those differences could not be accounted for using other nationally available data.
Commuter data also have several limitations, which is why it is not commonly used when discussing passenger vehicle death rates where miles traveled data are available. The biggest limitation is that commuter trips only comprised about 13% of all bicycle trips in 2009 and 20% of all bicycle trips in 2017, according to the National Household Travel Survey. 40
For pedestrian trips, commuting data are even less representative of actual travel as trips to earn a living were only 6.3% of pedestrian trips in 2009 and 7% in 2017. 41 In this way, commuter data do not provide good insight into total bicycling and walking where trips for other purposes can also vary across localities. Using commuter data also de-emphasizes people who do not commute such as youths, older adults, and people who do not work or who telework.
While commuter data may be used as a way to demonstrate relative risk, it is important that this not lead to bicyclist and pedestrian safety interventions that are only commuter-related.
Topic 2 – The Case for Safety in Numbers
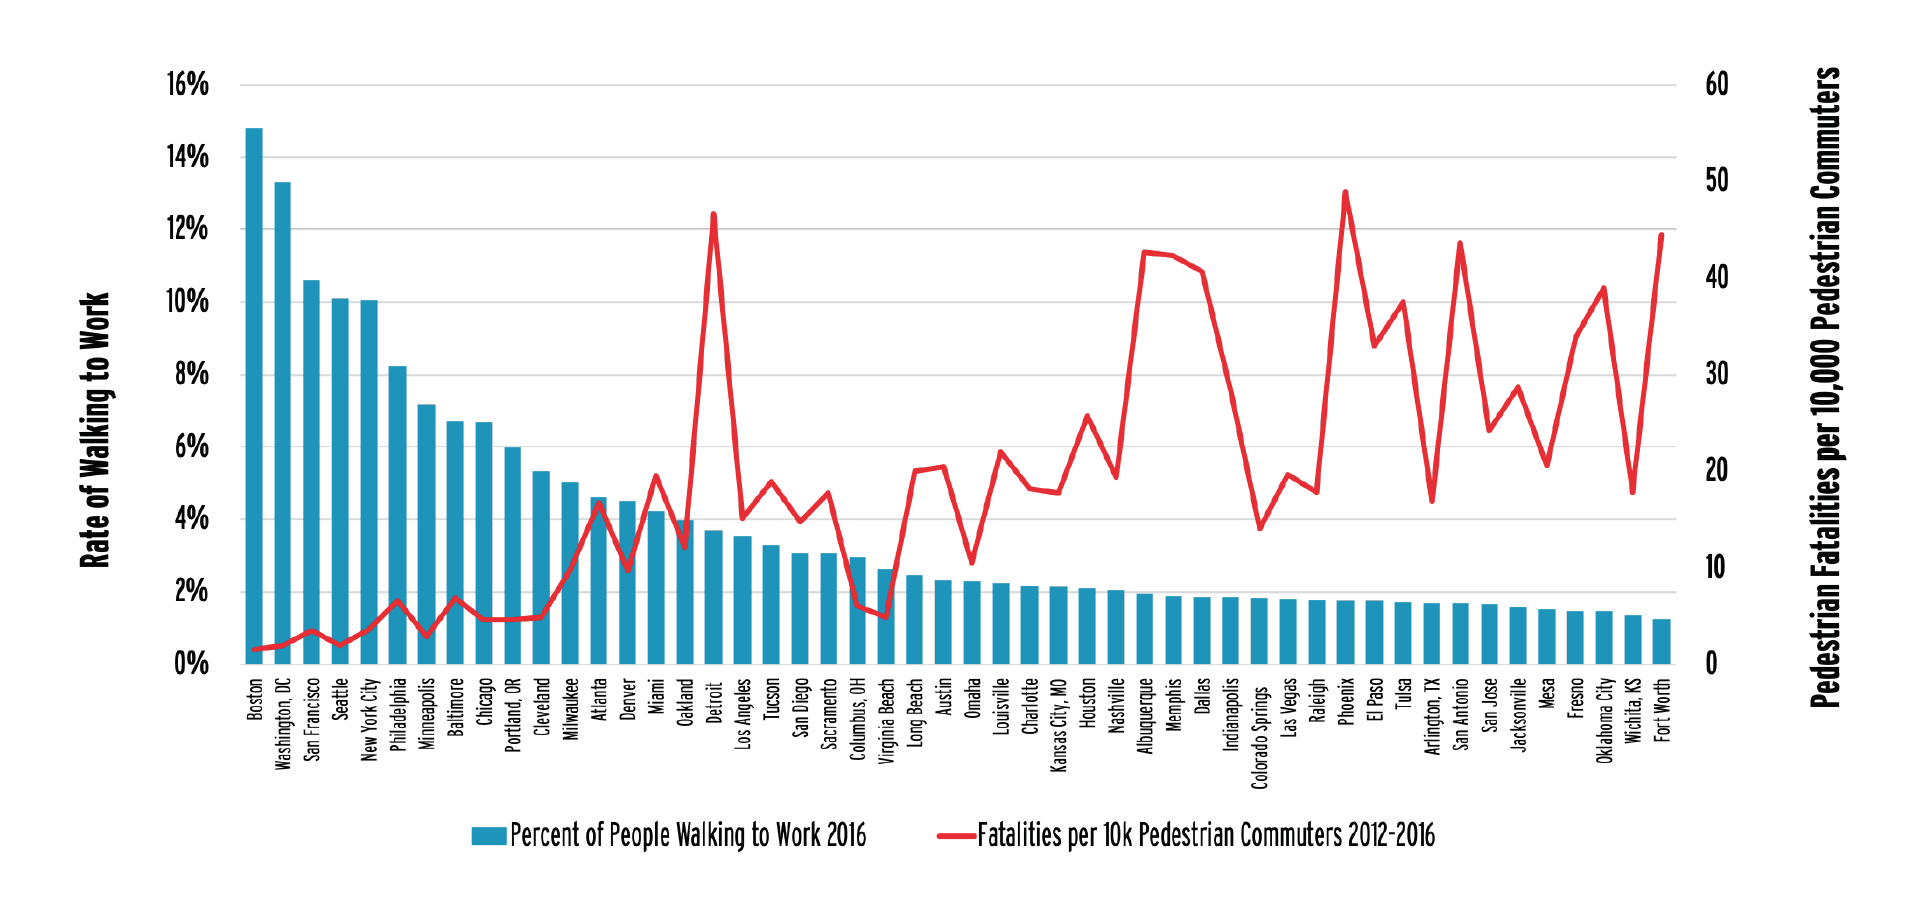
To see how levels of bicycling and walking affect safety, the League of American Bicyclists compared fatality rates in large cities to corresponding bicycle and pedestrian commute mode share. Data for the 50 largest U.S. cities indicates an inverse relationship between bicycling and walking levels and fatality rates.
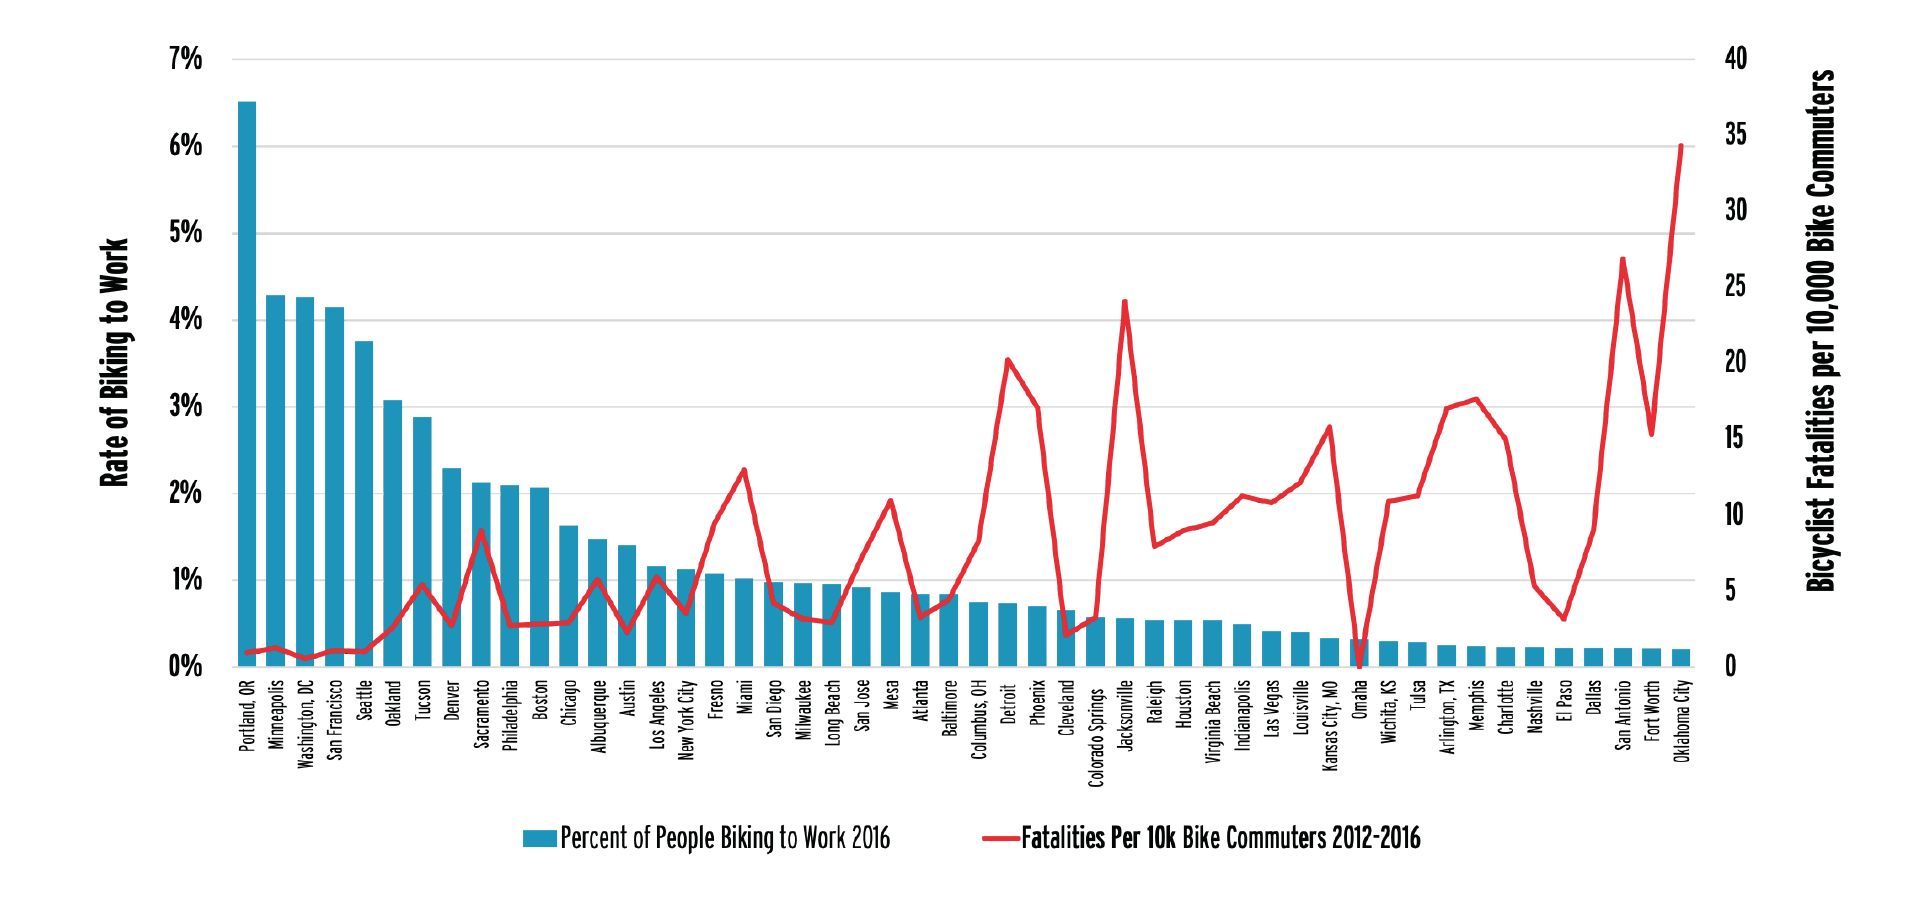
Cities with the highest rates of pedestrian fatalities are among those with the lowest levels of walking (r = -0.65). Similarly, cities with the highest levels of bicycling generally have lower bicycle fatality rates (r = -0.51). These results are consistent with previous research. 42 A 2016 editorial published in the American Journal of Public Health demonstrated that cities in the United States that grew both their bicycle network and number of bicycle trips had decreased rates of crashes, fatalities, and serious injuries per trip, where data were available. 43
Footnote 44
Footnote 45
Safety in numbers has been observed with specificity for pedestrians. One study from Hamilton, Ontario, Canada, found that “drivers seem to expect pedestrians when the pedestrian flow is over 30 pedestrians per hour.” 46 A prior study in Minneapolis also found, “The ‘safety-in-numbers’ effect was indeed observed in both the raw Minneapolis pedestrian and crash data, as well as the modeled data at the broader sample of intersections.” 47 This research may suggest a “dose” at which numbers have a safety effect.
While safety in numbers is an observed reality, researchers have less understanding of why the effect occurs. One explanation is that where more bicyclists and pedestrians are present, motorists are more used to sharing the roadways with bicyclists and are more aware of pedestrians at crossings. One recent study of cities in Norway, Denmark, and Sweden observed a seasonal safety in numbers trend, where seasonal weather – such as cold dark days in these Nordic countries – affects the numbers of people bicycling, suggesting that this general awareness of the likelihood of bicyclist presence has an effect on safety in numbers. 48 However, environmental factors (such as signed routes, bike lanes, and sidewalks) that contribute to increased bicycling and walking likely contribute to increased safety, too. 49 The relative importance of these factors is not yet known.
Topic 3 – The Case for Mode Shift as a Traffic Safety Intervention
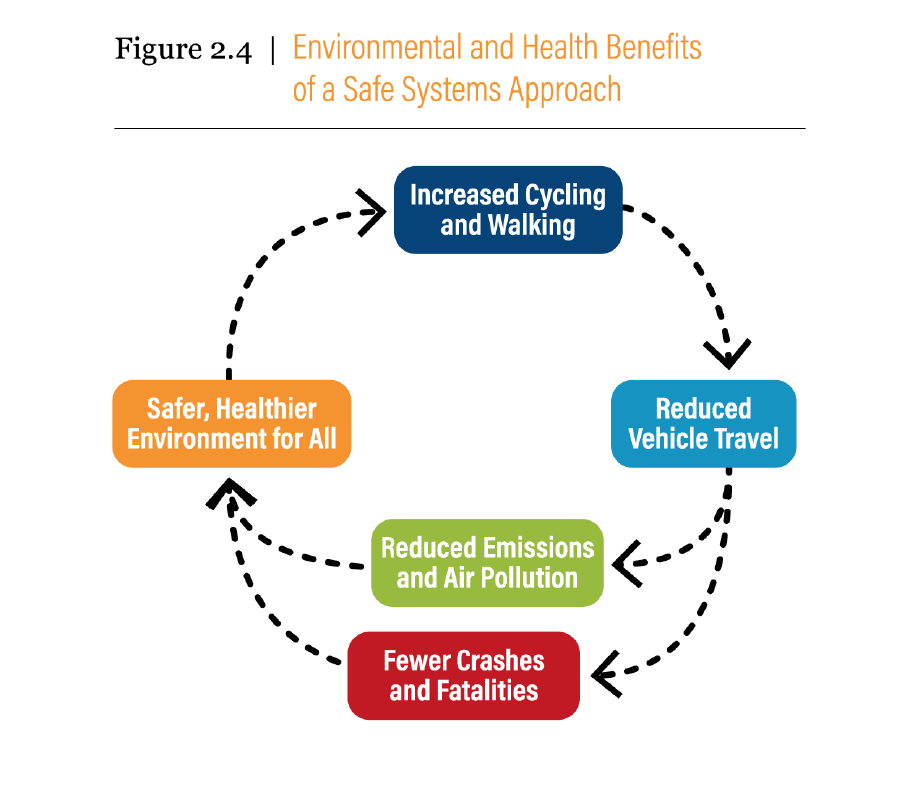
Places with more biking, walking, and transit tend to be safer for all road users. 50 A shift to modes that have a lower physical capacity for harm such as bicycling and walking may be an effective strategy to reduce road fatalities and serious injuries. Current models of health benefits tend to focus on chronic disease factors associated with physical activity rather than changes in roadway fatalities. 51 Research by the Victoria Transport Policy Institute indicates that “cities where residents average more than 50 annual transit trips have about half the average (per capita) traffic fatality rates as cities where residents average fewer than 20 annual transit trips.” 52 Research on modal shift suggests that it can be accomplished without an increase in the number of bicyclist and pedestrian deaths. 53
Bicyclists and pedestrians cause fewer deaths than do drivers of motor vehicles. For bicyclists and pedestrians, the reduced potential to cause deaths is based on basic physics– it is nearly impossible for a person bicycling or walking to generate the forces equivalent to crashing the average 4,000-pound motor vehicle. 54
Many traffic safety efforts do not address the inherent risks of time and distance spent traveling in motor vehicles. As an example, a recent report by the National Governors Association states that the rise in traffic fatalities is due in part to “increased exposure and mobility” but does not identify any strategies that would address that factor, instead focusing on addressing high-risk individual behaviors. 55 Shifting from motorized modes to non-motorized modes could help address this. Indeed, VMT correlates strongly with increased fatality numbers for all users. 56
Understanding traffic safety as a population-level public health problem is useful for discussing mode shift and is consistent with public health efforts to focus on prevention rather than treatment. A recent article from researchers in Australia argued that “the safety value of reducing average-risk travel has been underestimated.” 57 The value of a population strategy of prevention being necessary where risk is widely diffused through the whole population has similarly been articulated for preventive medicine in general. 58 According to researchers who have adopted a population health perspective, “Optimal reduction in the public health burden attributable to land transport was demonstrated when transport safety risk reduction policies were combined with land use and transport polices that minimized reliance on individual motorized transport and maximized use of active transport modes.” 59
Footnote 60
Mode shift is not a specific intervention, since it cannot be done through a single project or through a behavioral intervention. Instead, mode shift relies on a multitude of factors that make bicycling, walking, and transit more acceptable to a population than driving. Mode shift also does not target “unsafe” behaviors but rather seeks to move people from modes of travel with higher inherent risks to modes of travel with lower inherent risks. This is a shift from traditional traffic safety interventions that seek to address roadway designs, high-risk behaviors, or other instances where a lower level of safety is observed relative to a performance standard.
ADVANCING UNDERSTANDING: CURRENT LIMITATIONS ON UNDERSTANDING BICYCLING & WALKING SAFETY
Traffic safety efforts can miss understanding and addressing bicyclist and pedestrian safety needs for a number of reasons, but two issues persist that directly affect most quantitative-based traffic safety efforts.
INFORMATION IS LACKING ABOUT BICYCLE & PEDESTRIAN TRAVEL.
Nationally, three data sources provide insights on bicycle and pedestrian travel. Two have been available for the entirety of the Benchmarking Report project, and one is newly available. These data sources generally give a limited picture of bicycle and pedestrian travel or are infrequently available.
- THE AMERICAN COMMUNITY SURVEY (ACS) is conducted annually by the Census Bureau and provides data on commuting to work among people aged 16 years or older.
- THE NATIONAL HOUSEHOLD TRAVEL SURVEY (NHTS) is conducted once a decade by the Federal Highway Administration, providing data on all trips.
- THE TRAVEL MONITORING ANALYSIS SYSTEM (TMAS) has ongoing data collection by states on traffic volumes as reported to the Federal Highway Administration. This data collection system is what is currently used to create the Average Annual Daily Traffic (AADT) volume data or vehicle miles traveled (VMT) data used for motor vehicle traffic safety and engineering discussions.
For people who bicycle or walk, VMT has no equivalent denominator. Several attempts are underway to create equivalent measures, however, and the Travel Monitoring Analysis System recently began accepting non-motorized travel data. Since non-motorized travel monitoring is not yet commonplace, people have used the number of bicyclists and pedestrians heading to and from work as a proxy measure to estimate the safety of biking and walking.
AVAILABILITY & QUALITY OF DATA ABOUT BICYCLIST- & PEDESTRIAN-INVOLVED CRASHES
At the national level, only fatality estimates are available in a way that is comparable between states and cities. Serious injury data are available only at the national level, with no disaggregation for other jurisdictions. Further, there are observed biases in what is reported about bicyclist- and pedestrian- involved crashes since crashes that do not cause serious injuries or do not meet monetary damage thresholds often fail to be reported.
The Injury Surveillance Workgroups of the Safe States Alliance recently put out Consensus Recommendations for Pedestrian Injury Surveillance. 61 The 10 recommendations in the report include “Train all primary collectors of pedestrian injury data,” “Include estimates of pedestrian injury exposure so that risk can be calculated,” and “Make pedestrian-specific data collection a routine part of transportation data collection,” while noting “the inability to systematically collect and consistently measure walking exposure (NHTSA, 2013).” 62 The recommendations defined pedestrian exposure as “an observable period or point during which a pedestrian experiences the possibility of suffering an injury related to the act of being a pedestrian.” They suggest five types of exposure data to use: 1) population data, 2) trip count data, 3) travel time/distance data, 4) commute mode share data, and 5) count data. 63
As an alternative to creating appropriate systems to remedy the lack of national data on bicycling and walking, practitioners can promote bicycle- and pedestrian-related interventions based on more readily available motor vehicle data. An example is the National Association of City Transportation Officials (NACTO)’s “Designing for All Ages and Abilities” guidance, which makes bicycle facility recommendations based on motor vehicle speeds and volumes rather than bicyclist-related data. 64 With this type of guidance, no data on bicycling and walking are needed to recommend facilities for people who bike. However, this type of effort does not address population-level issues with understanding bicycle and pedestrian travel and bicyclist and pedestrian safety.
EMBRACING EQUITY: CURRENT TRAFFIC SAFETY PROBLEMS AS A REFLECTION OF DEMOGRAPHIC DIFFERENCES
Benchmarking data have shown prevalent over-representation of non-white persons and seniors in pedestrian fatalities. People of age 65 or older were overrepresented in pedestrian fatalities in 35 states. Non-white populations were overrepresented in pedestrian fatalities in 30 states. 65 This is consistent with other research that suggests that traffic fatalities reflect demographic differences. A report by Smart Growth America’s National Complete Streets Coalition found that black pedestrians are 60% more likely than white ones to be killed by cars while walking in the United States. 66
To learn more about the demographics of people killed while walking and biking, please see Chapter IV: Show Your Data.
MAKING THE HEALTH CONNECTION: THE HEALTHCARE COSTS & PREVENTABILITY OF ROAD DEATHS & SERIOUS INJURIES
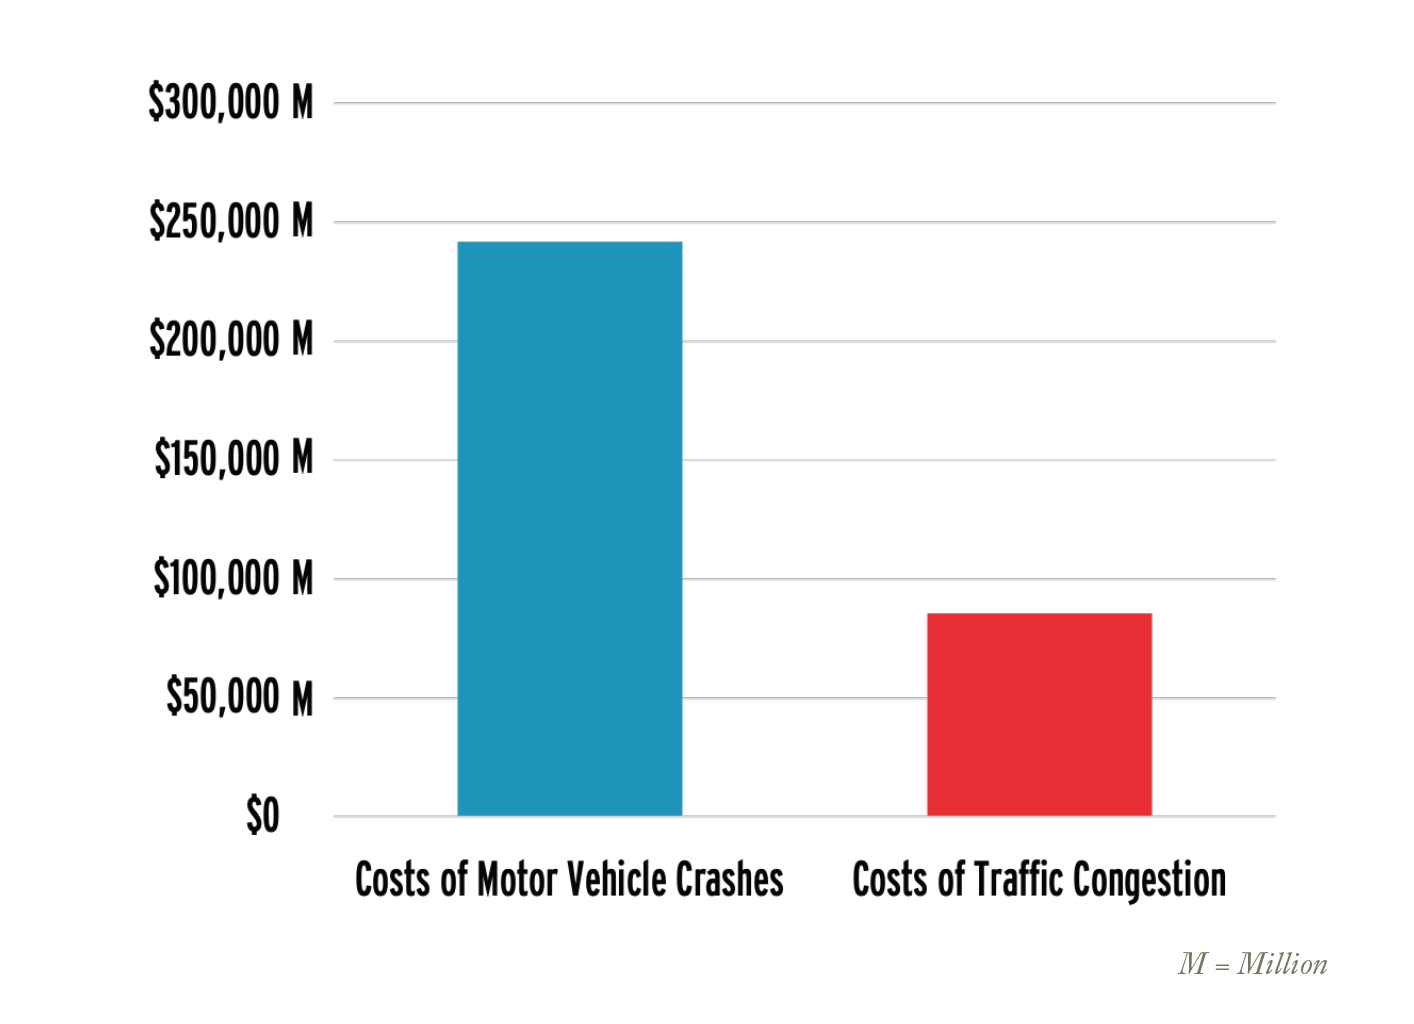
Traffic deaths and serious injuries are health problems leading to both premature death and significant healthcare costs. A 2015 National Highway Traffic Safety Administration (NHTSA) report indicated that motor vehicle crashes in 2010 (a year in which traffic fatalities were more than 4,000 fewer than in 2016) cost society $242 billion or the equivalent of $784 per person (1.6% of 2010 GDP). 67 The report estimated that medical and emergency services related to motor vehicle crashes resulted in approximately $24 billion in costs. 68
The estimated $242 billion in costs from motor vehicle crashes is nearly three times the estimated costs from congestion, which a 2009 report prepared by HDR, Inc. for the U.S. Department of Transportation estimated at $85.5 billion per year. 69
Footnote 70
For the federal government, transportation safety has fiscal impacts on Medicare and Medicaid programs. The same 2015 NHTSA report found that an analysis of Medicaid claims and Healthcare Cost and Utilization Project data concluded that “22% of adults ages 19 to 64 with hospital-admitted crash injuries covered by Medicaid (2.85% of all those admitted) became Medicaid-eligible because earnings losses and medical bills resulting from crash injury left them indigent or disabled.” 71 These one-time crash events also made it likely that people would continue to receive care through Medicaid, with an estimated “35% of those who convert to Medicaid to pay hospital bills stay on Medicaid indefinitely. The present value of their lifetime Medicaid health care costs averages $316,000.” 72
National Highway Traffic Administration (NHTSA). Fatality Analysis Reporting System (FARS) Encyclopedia. Available at https://www-fars.nhtsa.dot.gov/Main/index.aspx.
National Complete Streets Coalition. Dangerous by Design. Available at https://smartgrowthamerica.org/program/national-complete-streets-coalition/dangerous-by-design/.
Centers for Disease Control and Prevention. Web-based Injury Statistics Query and Reporting Systems (WISQARS) Leading Causes of Nonfatal Injury Reports, 2000-2016. Available at https://webappa.cdc.gov/sasweb/ncipc/nfilead.html.
Insurance Institute for Highway Safety Highway Loss Data Institute. Fatality Facts – Bicyclists. Available at https://iihs.org/iihs/topics/t/pedestrians-and-bicyclists/fatalityfacts/bicycles. U.S. Census Bureau. American Community Survey B01003 Table 1-year estimate (2016). Available at https:// factfinder.census.gov/faces/nav/jsf/pages/index.xhtml
Insurance Institute for Highway Safety Highway Loss Data Institute. Fatality Facts – Bicyclists. Available at https://iihs.org/iihs/topics/t/pedestrians-and-bicyclists/fatalityfacts/bicycles. U.S. Census Bureau. American Community Survey B01003 Table 1-year estimate (2016). Available at https:// factfinder.census.gov/faces/nav/jsf/pages/index.xhtml
Insurance Institute for Highway Safety Highway Loss Data Institute. Fatality Facts – Bicyclists. Available at https://iihs.org/iihs/topics/t/pedestrians-and-bicyclists/fatalityfacts/bicycles. U.S. Census Bureau. American Community Survey B01003 Table 1-year estimate (2016). Available at https:// factfinder.census.gov/faces/nav/jsf/pages/index.xhtml
See e.g. National Highway Traffic Administration (NHTSA). Fatality Analysis Reporting System (FARS) Available at https://www-fars. nhtsa.dot.gov/Main/index.aspx
See e.g. National Highway Traffic Administration (NHTSA). Fatality Analysis Reporting System (FARS) Available at https://www-fars. nhtsa.dot.gov/Main/index.aspx
See e.g. National Highway Traffic Administration (NHTSA). Fatality Analysis Reporting System (FARS) Available at https://www-fars. nhtsa.dot.gov/Main/index.aspx
Karl Kim and Rune Accident Analysis and Prevention (2005). A Tribute to Frank Haight. Available at http://www.academia. edu/21111961/A_Tribute_to_Frank_A._Haight.
Halperin. A Comparative Analysis of Six Methods for Calculating Travel Fatality Risk, RISK: Health, Safety & Environment (1993), at 18 quoting Haight, Road Safety: A Perspective and a New Strategy, 16 J. Safety Resh. 91 (1985). Available at https://scholars.unh.edu/cgi/viewcontent.cgi?refer- er=https://www.google.com/&httpsredir=1&article=1119&concont=risk
See discussion of National Household Travel Survey data in Chapter IV: Show Your Data I:
Krista Nordback, Washington State Pedestrian and Bicycle Miles Traveled Project. Available at http://trec.pdx.edu/research/project/708/Washington_State_Pedestrian_and_Bicycle_Miles_Traveled_Project_
Greg Lindsey and Jessica Schoner. Performance Measures for Bicycling: Trips and Miles Traveled in Minnesota (2016). Available at https://conservancy.umn.edu/bitstream/handle/11299/185231/Performance%20Measures%20for%20Bicycling%20in%20Minnesota.pdf?sequence=1&isAllowed=y.
Oregon Department of Transportation. Oregon Bicycle and Pedestrian Plan (Adopted May 19, 2016) in strategy 1.1N at p. 31. Available at http://www.gov/ODOT/Planning/Documents/OBPP.pdf.
See discussion of National Household Travel Survey data in Chapter IV: Show Your Data I: Nation.
See discussion of National Household Travel Survey data in Chapter IV: Show Your Data I: Nation.
This relationship has been shown in several past editions of the Benchmarking Report, including 2016 and The 2014 Report included references to Jacobsen and Rutter, 2012; Pucher and Buehler, 2010; Buehler and Pucher, 2012; Elvik, 2009; Jacobsen, 2003; Pucher et al., 2011; Vandenbulcke et al., 2009.
Ralph Buehler and John Pucher. American Journal of Public Health (December 2016, Vol 106, 12). Safer Cycling Through Improved Infrastructure. Available at https://ajph.aphapublications.org/doi/pdf/10.2105/AJPH.2016.303507.
U.S. Census Bureau. American Community Survey Table B08006 5-year estimate (2016). Available at https://factfinder.census.gov/faces/nav/jsf/pag- es/index.xhtml. National Highway Traffic Administration (NHTSA). Fatality Analysis Reporting System (FARS) Encyclopedia (2012-2016). Available at https://www-fars.nhtsa.dot.gov/Main/index.aspx.
U.S. Census Bureau. American Community Survey Table B08006 5-year estimate (2016). Available at https://factfinder.census.gov/faces/nav/jsf/pag- es/index.xhtml. National Highway Traffic Administration (NHTSA). Fatality Analysis Reporting System (FARS) Encyclopedia (2012-2016). Available at https://www-fars.nhtsa.dot.gov/Main/index.aspx.
Kristin Carlson, Brendan Murphy, Alireza Ermagun, David M Levinson, Andrew Safety in Numbers: Pedestrian and Bicyclist Activity and Safety in Minneapolis ( March 2018) Report no. CTS 18-05 at 45 (referencing Leden, L. Accident Analysis and Prevention. Pedestrian risk decrease with pedestrian flow: A case study based on data from signalized intersections in Hamilton, Ontario (2002) at 457–464). Available at http://www.cts.umn.edu/ Publications/ResearchReports/reportdetail.html?id=2656.
Brendan Murphy, David Levinson, and Andrew Evaluating the “Safety in Numbers” Effect with Estimated Pedestrian Activity (2015) at p. 15. Available at https://conservancy.umn.edu/bitstream/handle/11299/179818/SafetyInNumbers.pdf%3Bsequence=1.
Aslak Fyhri, Torkel Bjørnskau, Aliaksei Laureshyn, Hanne Beate Sundfør, and Rikke Institute of Transport Economics Norwegian Centre for Transport Research. Safety in Numbers – uncovering the mechanisms of interplay in urban transport (2016). Available at https://www.toi.no/ getfile.php/1342933/Publikasjoner/T%C3%98I%20rapporter/2016/1466-2016/summary.pdf
Alliance for Biking and Walking. Bicycling and Walking in the United States: 2014 Benchmarking Report at p. Available at https://bikeleague.org/ sites/default/files/2014BenchmarkingReport.pdf.
See, e.g. Richard Florida. The Geography of Car Deaths in America (10/15/2015). Available at https://www.citylab.com/transportation/2015/10/the-geography-of-car-deaths-in-america/410494.
See discussion of ITHIM and HEAT in previous section
Todd Litman, Victoria Transport Policy Institute (July 24, 2018). Safer Than You Think! Revising the Transit Safety Narrative at p. Available at http://www.vtpi.org/safer.pdf. See also American Public Transportation Association. The Hidden Traffic Safety Solution: Public Transportation (September 2016). Available at https://www.apta.com/resources/reportsandpublications/Documents/APTA-Hidden-Traffic-Safety-Solution-Public-Transportation.pdf.
J.P. Schepers and E. Heinen. Science Direct. How Does a Modal Shift from Short Car Trips to Cycling Affect Road Safety? Available at https://www.sciencedirect.com/science/article/pii/S0001457512003119#fig0005. See also Rune Elvik. Science Direct. Accident Analysis and Prevention (Volume 4(4), July 2009). The Non-Linearity of Risk and the Promotion of Environmentally Sustainable Transport at pp. 849-855. Available at https://www.science- direct.com/science/article/abs/pii/S0001457509000876.
Danny Hakim. The New York Times. Average U.S. Car is Tipping Scales at 4,000 Pounds (5/5/2004). Available at https://www.nytimes.com/2004/05/05/business/average-us-car-is-tipping-scales-at-4000-pounds.html.
National Governors Association. State Strategies to Reduce Highway and Traffic Fatalities and Injuries: A Road Map for States (2018) at p. Available at https://www.nga.org/center/publications/state-strategies-to-reduce-highway-and-traffic-fatalities-and-injuries-a-road-map-for-states/.
See Insurance Institute for Highway Safety. A Projection of United States Traffic Fatality Counts in 2024 (April 2017). Available at https://www.iihs. org/frontend/iihs/documents/masterfiledocs.ashx?id=2137 (“Each 1% increase in VMT was associated with a 0.96% increase in fatalities.“)
May et al. / Journal of Transport Geography 19 (2011) 1423–1430 at 1426 retrieved at https://blogs.otago.ac.nz/amc/files/2011/08/May-Tranter- Warn-JTG-road-safety.pdf. (referencing Johnston, I., 2010. Beyond ‘‘best practice’’ road safety thinking and systems management – a case for culture change research. Safety Science 48, 1175– 1181)
May et al. Journal of Transport Geography (Volume 19; 2011). Progressing road safety through deep change and transformational leadership at p. 1426. Available at https://blogs.otago.ac.nz/amc/files/2011/08/May-Tranter-Warn-JTG-road-safety.pdf.
Roderick J. McClure, Claudia Adriazola-Steil, Christine Mulvihill, Michael Fitzharris, Paul Salmon, C. Paul Bonnington, and Mark Stevenson. American Journal of Public Health (April 2015). Simulating the Dynamic Effect of Land Use and Transport Policies on the Health of Populations. Available at https://ncbi.nlm.nih.gov/pmc/articles/PMC4355720/
Ben Welle et World Resources Institute, Ross Center. In Collaboration with Bloomberg Philanthropies Foundation. Global Road Safety Facility. Embarq. Sustainable and Safe: A Vision and Guidance for Zero Road Deaths at p. 24. Available at http://www.wri.org/sites/default/files/17_Report_Safe_ Systems_final.pdf.
Injury Surveillance Workgroup 8. Consensus Recommendations for Pedestrian Injury Surveillance. Atlanta (GA): Safe States Alliance (2017). Available at http://c.ymcdn.com/sites/www.safestates.org/resource/resmgr/ISW8_Report_Final.pdf.
Injury Surveillance Workgroup 8. Consensus Recommendations for Pedestrian Injury Surveillance. Atlanta (GA): Safe States Alliance (2017). Available at http://c.ymcdn.com/sites/www.safestates.org/resource/resmgr/ISW8_Report_Final.pdf (at p. 11).
Injury Surveillance Workgroup 8. Consensus Recommendations for Pedestrian Injury Surveillance. Atlanta (GA): Safe States Alliance (2017). Available at http://c.ymcdn.com/sites/www.safestates.org/resource/resmgr/ISW8_Report_Final.pdf (chapter on “Utilizing Pedestrian Exposure and Risk Data”).
National Association of City Transportation Officials. Designing for All Ages & Abilities: Contextual Guidance for High-Comfort Bicycle Facilities (December 2017) at p. 4. Available at https://nacto.org/wp-content/uploads/2017/12/NACTO_Designing-for-All-Ages-Abilities.pdf.
Note: Pennsylvania did not code any pedestrian fatalities with information on the race of the person killed so it is impossible to comment of the demo- graphics of pedestrians killed by drivers in Pennsylvania using federal fatality
Stefanie Seskin. Smart Growth America. Dangerous by Design 2014 Highlights Preventable Pedestrian Fatalities (May 20, 2014). Available at http://www.smartgrowthamerica.org/2014/05/20/dangerous-by-design-2014-highlightspreventable-pedestrian-fatalities.
National Highway Traffic Safety Administration (NHTSA). The Economic and Societal Impact Of Motor Vehicle Crashes, 2010 (May 2015 Revised). Available at https://crashstats.nhtsa.dot.gov/Api/Public/ViewPublication/812013.
National Highway Traffic Safety Administration (NHTSA). The Economic and Societal Impact Of Motor Vehicle Crashes, 2010 (May 2015 Revised). Available at https://crashstats.nhtsa.dot.gov/Api/Public/ViewPublication/812013 (table 14-4 at p. 239).
Prepared by HDR for the Office of Economic and Strategic Analysis, S. Department of Transportation. Assessing the Full Costs of Congestion on Surface Transportation Systems and Reducing Them through Pricing (February 2009) at p. 236. Available at https://www.transportation.gov/sites/dot.gov/ files/docs/Costs%20of%20Surface%20Transportation%20Congestion.pdf.
National Highway Traffic Safety Administration (NHTSA). The Economic and Societal Impact Of Motor Vehicle Crashes, 2010 (May 2015 Revised). Available at https://crashstats.nhtsa.dot.gov/Api/Public/ViewPublication/812013 (table 14-4 at p. 239). And Prepared by HDR for the Office of Economic and Strategic Analysis, S. Department of Transportation. Assessing the Full Costs of Congestion on Surface Transportation Systems and Reducing Them through Pricing (February 2009) at p. 236. Available at https://www.transportation.gov/sites/dot.gov/ files/docs/Costs%20of%20Surface%20Transportation%20Congestion.pdf.
National Highway Traffic Safety Administration (NHTSA). The Economic and Societal Impact Of Motor Vehicle Crashes, 2010 (May 2015 Revised). Available at https://crashstats.nhtsa.dot.gov/Api/Public/ViewPublication/812013 (at p. 236).
National Highway Traffic Safety Administration (NHTSA). The Economic and Societal Impact Of Motor Vehicle Crashes, 2010 (May 2015 Revised). Available at https://crashstats.nhtsa.dot.gov/Api/Public/ViewPublication/812013 (at p. 236).
