IN THIS SECTION, THE BENCHMARKING REPORT EXPLORES HOW AND WHETHER INFRASTRUCTURE FOR BICYCLING AND WALKING IS PROVIDED. THIS INCLUDES THE TYPES OF PEOPLE SERVED BY BICYCLING AND WALKING INFRASTRUCTURE AND WAYS THAT THE BENCHMARKING REPORT HAS TRACKED INFRASTRUCTURE OVER TIME.
Use this section to learn about different types of bicycle and pedestrian infrastructure and ways they promote biking and walking safety.
Making the Case: Bicycle & Pedestrian Infrastructure Improves Safety for All
- Advances in Bicycle & Pedestrian Infrastructure
- How Bicyclist & Pedestrian Infrastructure Improves Safety
- The Case for Bicycle Infrastructure Increasing Use
Advancing Understanding: The Need for Better Pedestrian & Bicycle Network Data
Embracing Equity: Considering Who is Served by Infrastructure & Why it is Provided
MAKING THE CASE: BICYCLE & PEDESTRIAN INFRASTRUCTURE IMPROVES SAFETY FOR ALL
Advances in Bicycle & Pedestrian Infrastructure
In the initial Benchmarking Report on Bicycling and Walking published in 2007, the authors focused on providing basic information on three types of bicyclist and pedestrian infrastructure: signed bike routes, on-street striped bike lanes, and multi-use paths. 1 In each subsequent edition of the report, discussion of bicycle and pedestrian infrastructure expanded, with an increasing focus on innovative and specialized facilities uncommon in most cities.
Footnote 2
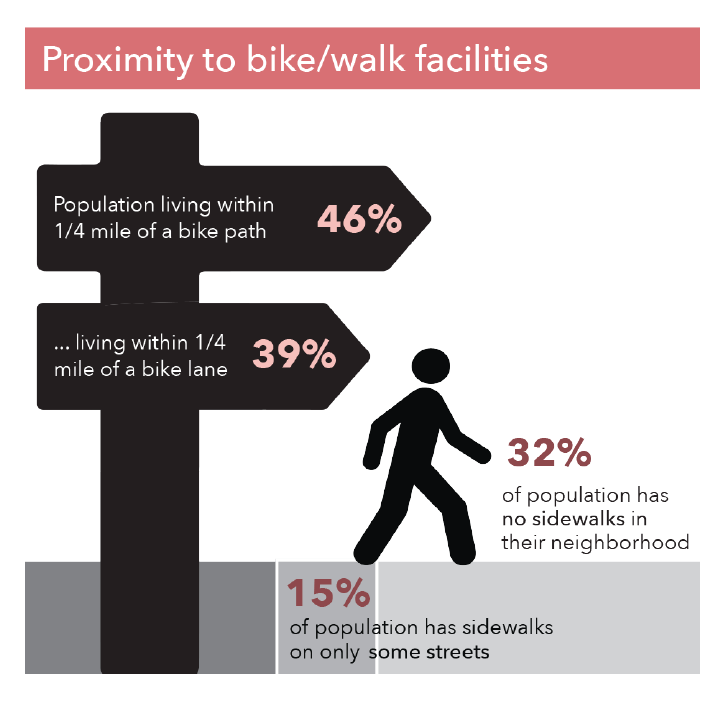
While the Benchmarking Report often highlights innovative and specialized infrastructure that cities and states can use to make bicycling and walking safer and more comfortable, surveys suggest that many Americans lack access to basic infrastructure for bicycling and walking.
According to a 2012 survey by the National Highway Traffic Safety Administration (NHTSA), 46% of individual respondents across the U.S. stated that they live within a quarter mile of a bike path (“paths away from the road on which bikes can travel”). Only 39% stated that they live within a quarter-mile of a bike lane (“marked lanes on a public road reserved for bikes to travel”). Thirty- two percent of respondents stated that no streets in their neighborhood had sidewalks, and an additional 15% said that only some streets had sidewalks.
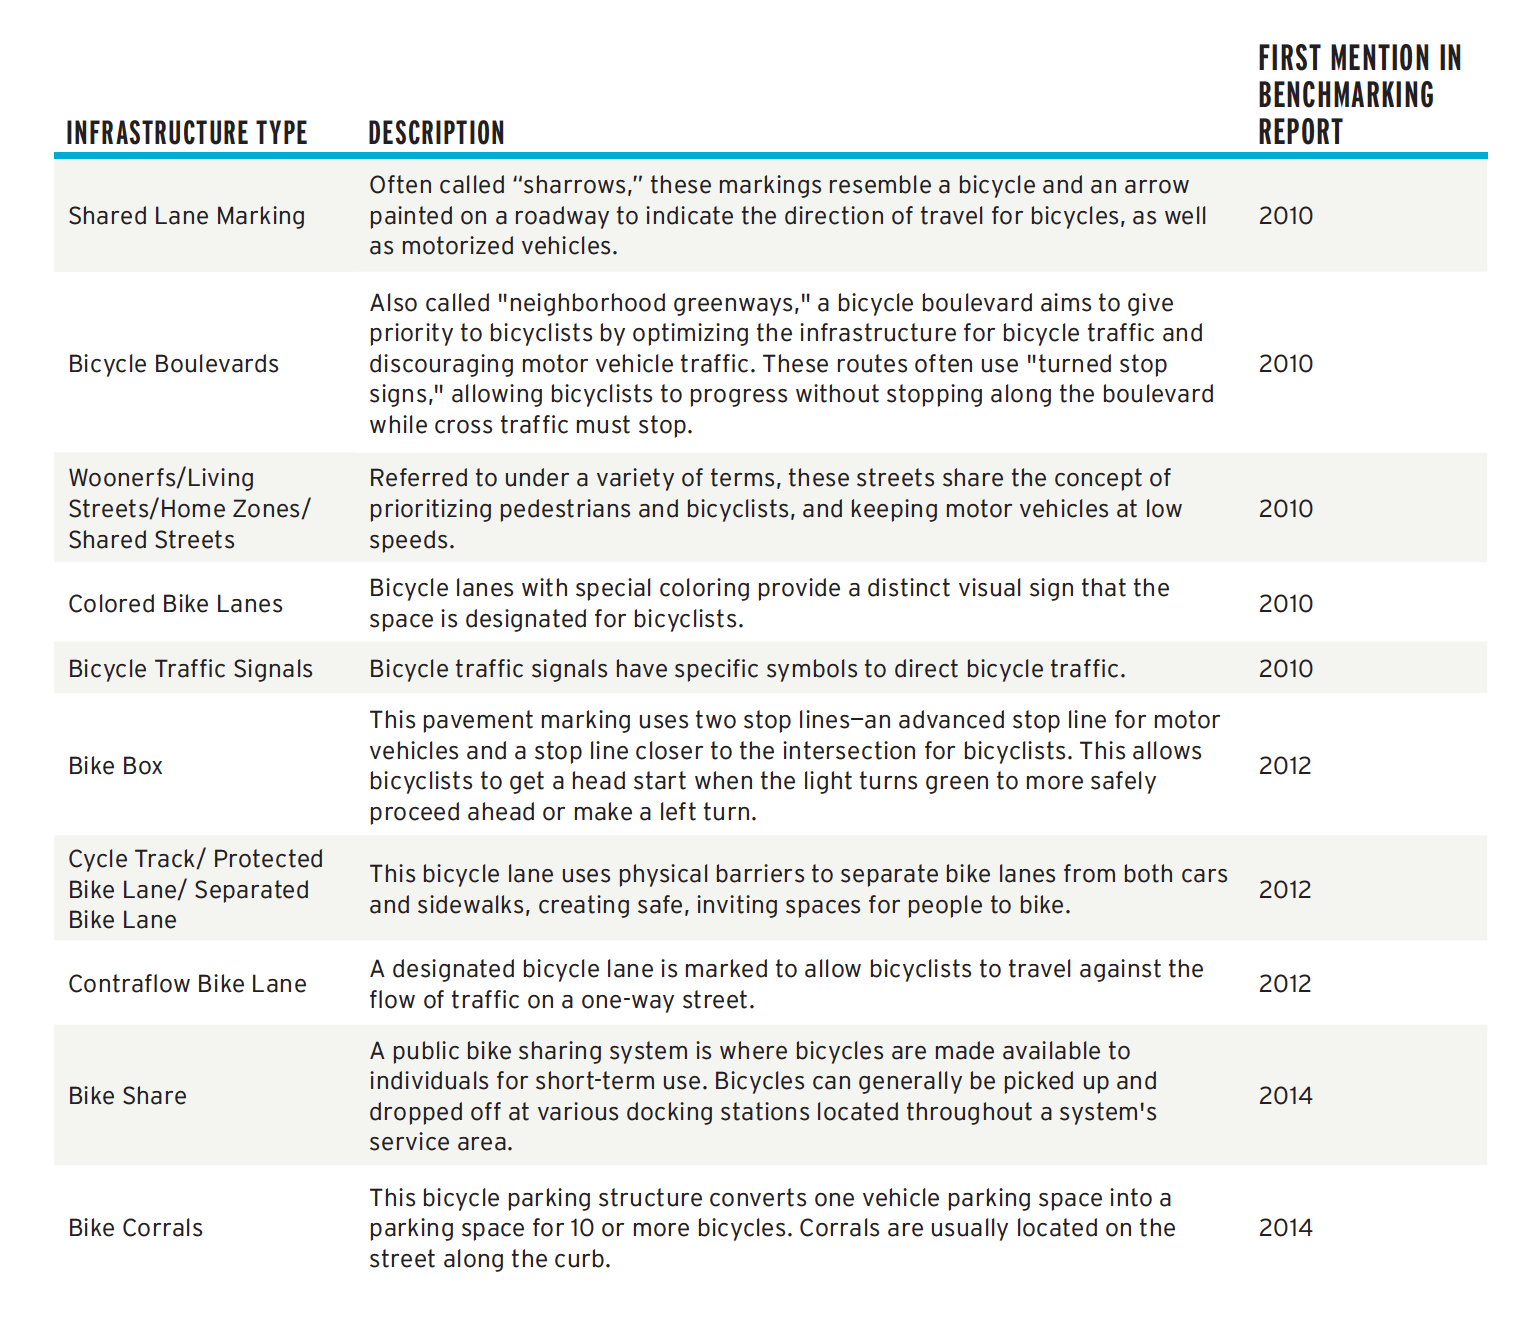
The 2016 Benchmarking Report did not add any additional specialized infrastructure and did not report on the existence of most of the specialized facilities listed above.
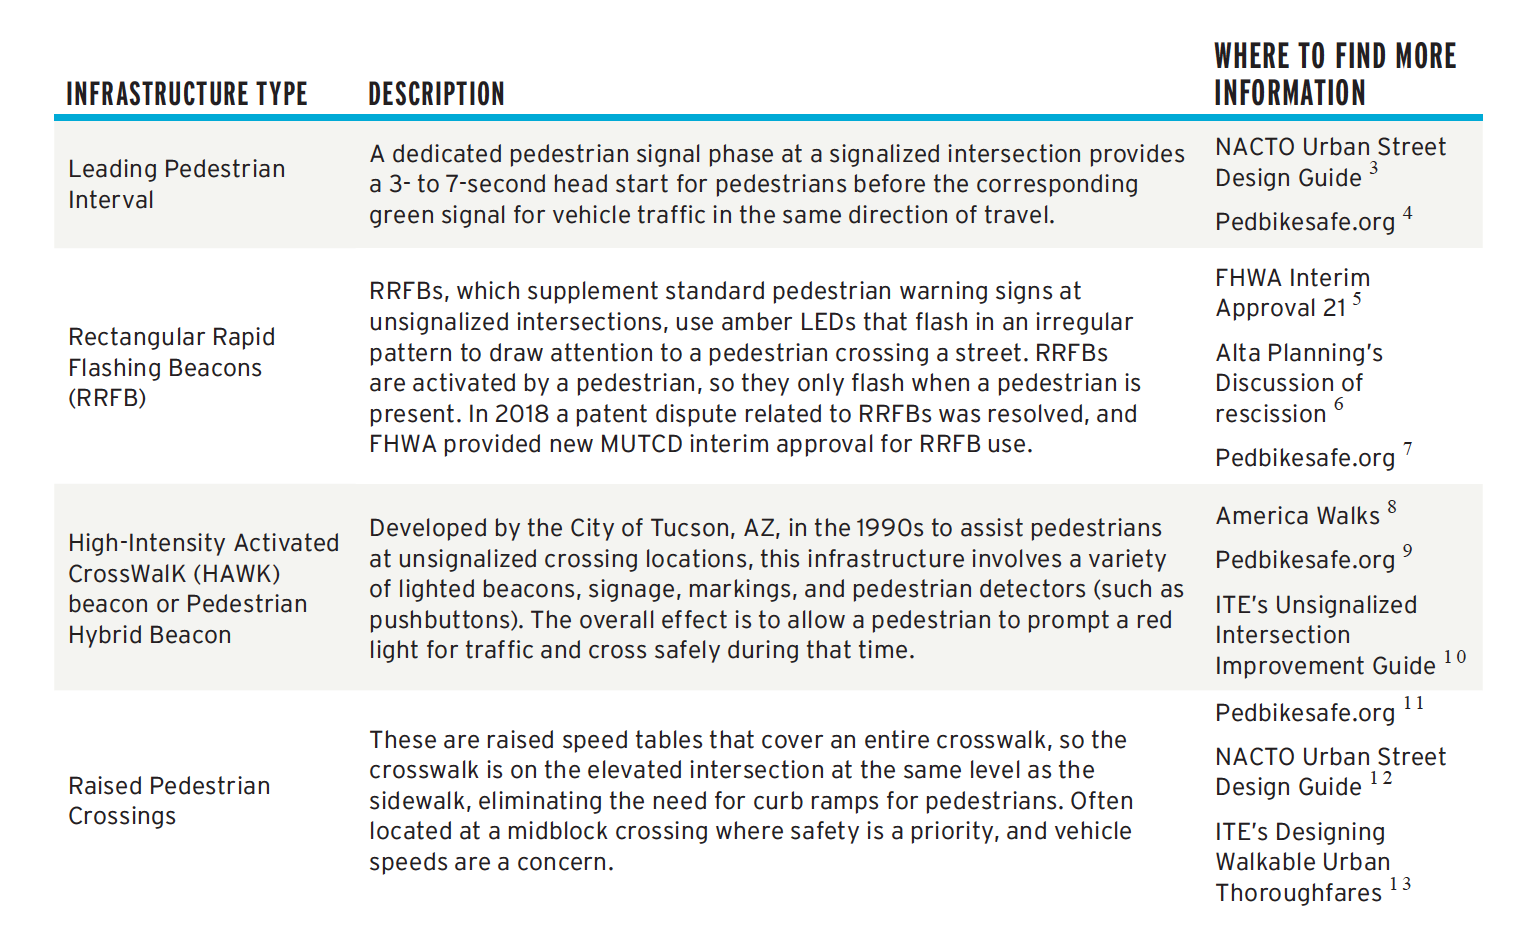
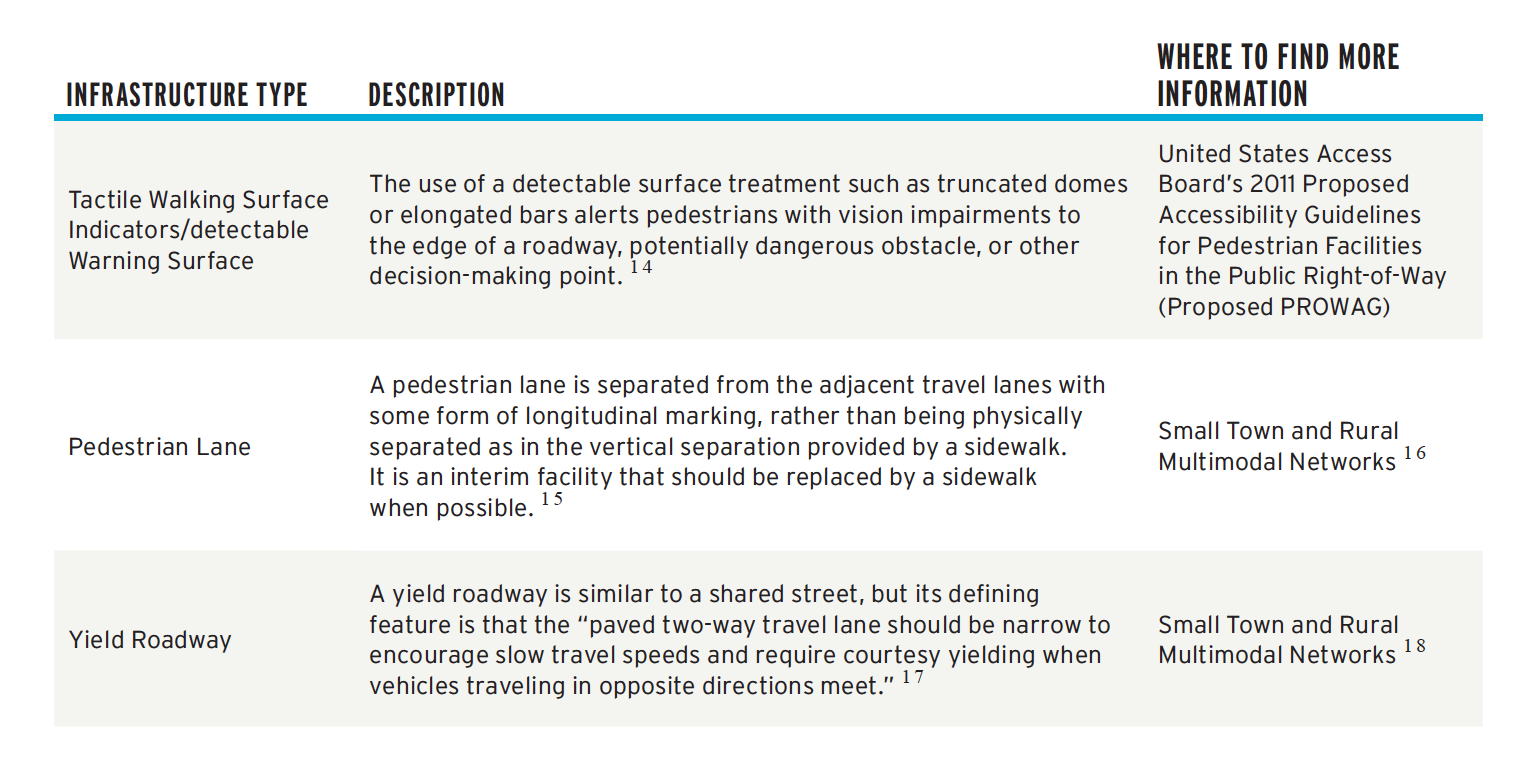
Of note, too, is that the innovative and specialized infrastructure types reported on in the past Benchmarking Reports overwhelmingly deal with infrastructure for people who bicycle. To counter any impression that there are not similar innovations or the development of specialized pedestrian infrastructure technologies, several additional pedestrian facilities are identified below.
Footnotes 3 4 5 6 7 8 9 10 11 12 13
The recent increase in specialized infrastructure for people who bike and walk corresponds with the publication of a wide variety of design guidance on this type of infrastructure. According to data compiled by the Pedestrian and Bicyclist Information Center (PBIC), at least 27 design guides for biking and walking infrastructure have been published since 2004. 19
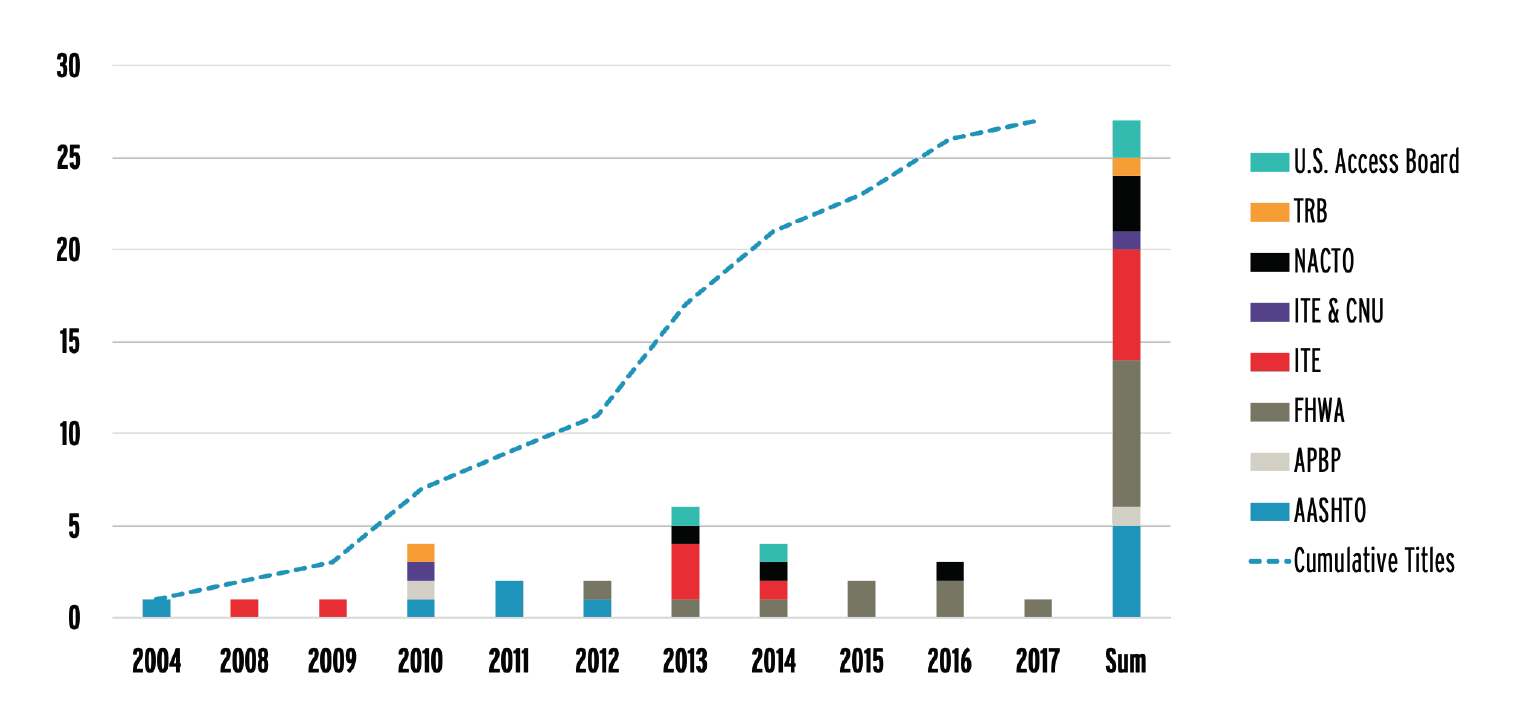
In coming years, many of the older design guides in the PBIC’s data will be updated, providing opportunities to standardize many “innovative” designs. Standardization is needed, given the variety of labels used for various infrastructure types previously discussed in the Benchmarking Report. AASHTO is likely to update its influential Guide for the Planning and Design of Bicycle Facilities in 2019. It will be interesting to see how or whether the AASHTO update incorporates publications from ITE, FHWA, NACTO, and the U.S. Access Board published since AASHTO last released a bicyclist or pedestrian-related design guide in 2012.
Three additional bicycle infrastructure types were suggested by the Benchmarking Project team for inclusion.
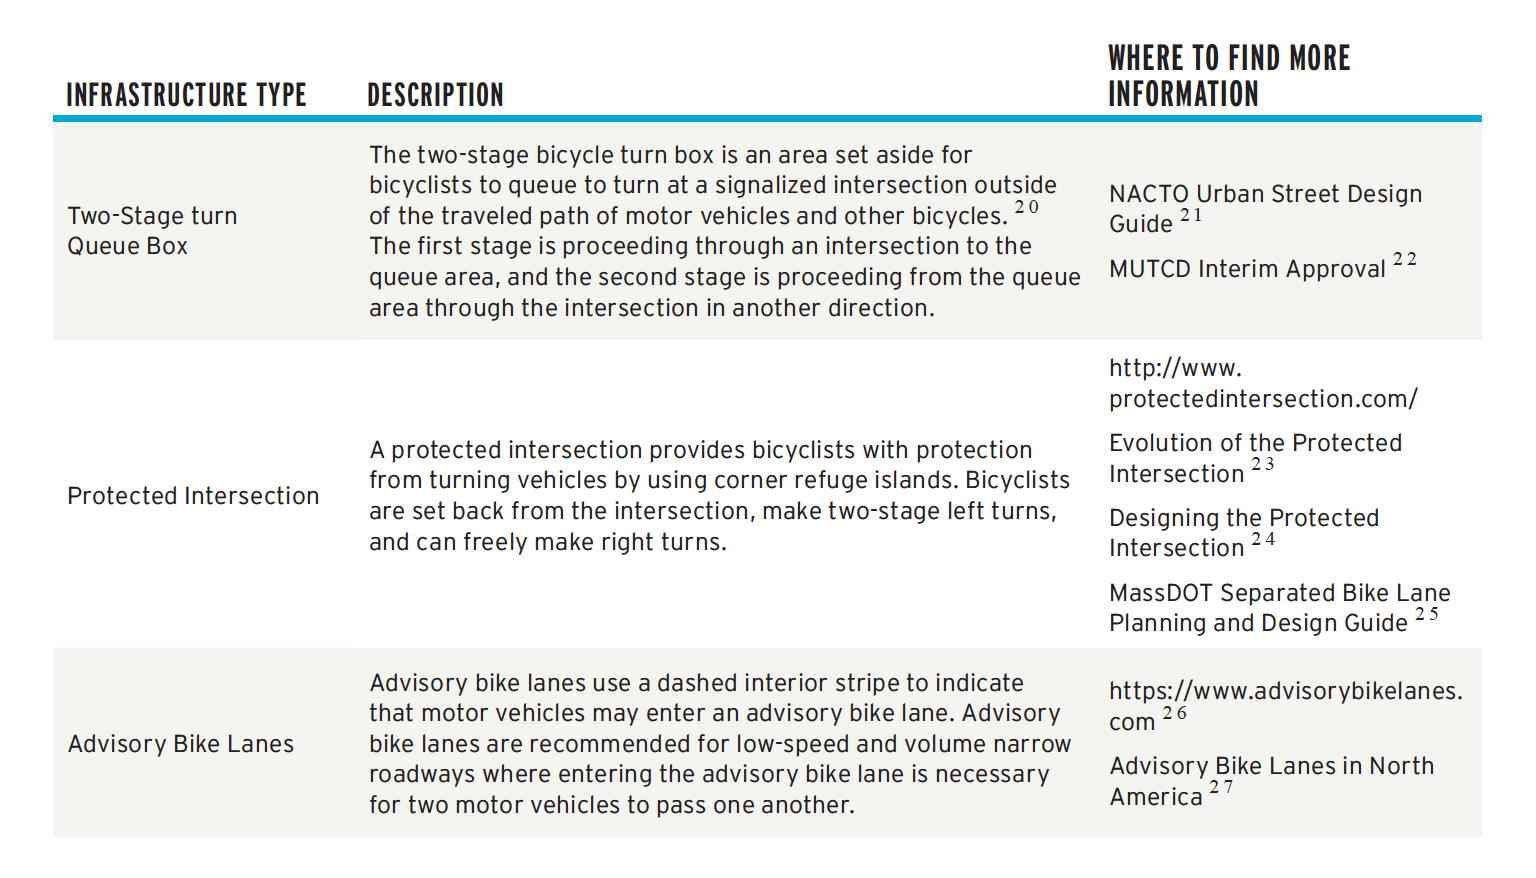
Footnotes 20 21 22 23 24 25 26 27
How Bicyclist & Pedestrian Infrastructure Improves Safety
| BETTER BICYCLE FACILITIES are directly correlated with increased safety for people walking and driving as well. |
Just as road infrastructure facilitates safe, accessible routes for motorized vehicles, so too is appropriate infrastructure critical for safe, accessible routes for bicycling and walking. 28 A study from Ryerson’s School of Occupational and Public Health looked at how transportation infrastructure affects the potential risk of bicyclists in Canada. The study concluded that having infrastructure elements that slow traffic and separate bicyclists from both vehicular traffic and pedestrians (for example, cycle tracks), significantly reduced the risk of injury for bicyclists. It also found that separated paths for bicycling were much safer than painted lanes or sharrows, which seemed to offer little protection. 29
Recently, the National Association of City Transportation Officials (NACTO) published guidance for communities seeking to build bicycle networks suitable for people of all ages and abilities. These guidelines stress safety based on the experience of NACTO cities, where “[a]mong seven NACTO cities that grew the lane mileage of their bikeway networks 50% between 2007–2014, ridership more than doubled, while risk of death and serious injury to people biking was halved. Better bicycle facilities are directly correlated with increased safety for people walking and driving as well.” 30
Going beyond network mileage, the NACTO guidance includes two factors associated with safety and stress: traffic speed and traffic volume. “These factors are inversely related to comfort and safety; even small increases in either factor can quickly increase stress and potentially increase injury risk.” 31 These factors also contribute to “near misses”—or non-injury incidents that cause stress—which can contribute to discouraging people from riding who would otherwise do so.
Speed is a recurring theme in traffic safety. In August 2017, the National Transportation Safety Board issued a report on speed and speeding, concluding “the current level of emphasis on speeding as a national traffic safety issue is lower than warranted.” 32 The report states that “[s]peed— and therefore speeding—increases crash risk in two ways: (1) it increases the likelihood of being involved in a crash, and (2) it increases the severity of injuries sustained by all road users in a crash.” 33 As an example of how speed increases the severity of injuries, a 2011 AAA report found that in the United States, there is “a 10% risk of severe injury for people walking hit by a vehicle traveling over 20 mph, [which] increased to 50% if the vehicle was traveling over 30 mph, and 90% over 40 mph.” 34 NTSB identified the need to increase public understanding of speed policy and speed enforcement as an area of importance.
A recent report on Speed and Crash Risk from the International Traffic Safety Data and Analysis Group also highlighted the role of speed on crash occurrence and severity, saying, “[A] 1% increase in average speed results in approximately a 2% increase in injury crash frequency, a 3% increase in severe crash frequency, and a 4% increase in fatal crash frequency.” 35
Footnote 36
To reduce the safety risks caused by speeding the NTSB recommended that “the FHWA revise Section 2B.13 of the MUTCD so that the factors currently listed as optional for all engineering studies are required, require that an expert system such as USLIMITS2 be used as a validation tool, and remove the guidance that speed limits in speed zones should be within 5 mph of the 85th percentile speed.” 37
This recommendation is based on the NTSB’s finding that “there is not strong evidence that, within a given traffic flow, the 85th percentile speed equates to the speed with the lowest crash involvement rate on all road types” 38 and that raising the speed limit to match the 85th percentile speed “generates an undesirable cycle of speed escalation and reduced safety.” 39 The NTSB also found that using the 85th percentile speed does not consider vulnerable road users and is not consistent with a Safe Systems approach, where “speed limits are set to minimize death and serious injury as a consequence of a crash.” 40
Effective speed reduction occurs when streets are designed and built to encourage people to drive more slowly. 41 Traffic calming to reduce speed often explicitly includes facilities for bicyclists and pedestrians, such as pedestrian crossing medians or bicycle lanes that narrow travel lanes. 42 It is important to note that these designs benefit everyone on the road through reduced risks associated with lower speeds and their value does not depend on bicycle or pedestrian use of these facilities.
The Case for Bicycle Infrastructure Increasing Use
Traffic calming features and dedicated bicycle infrastructure can significantly affect bicycling levels. Infrastructure shown to increase bicycling levels include bicycle boulevards, speed humps, curb extensions, pedestrian crossways, and separated bike lanes. 43 Studies in Copenhagen; London; Washington, DC; and Montreal have all found that cycle tracks or protected bicycle lanes attract more bicyclists than similar streets without such infrastructure. 44 Bicyclists were willing to reroute their paths to use specialized infrastructure in Portland, OR, and go the furthest out of their way to cycle on off-street bike paths followed by bicycle boulevards. 45
Studies have found that women in particular prefer facilities with less motor vehicle traffic and bicycle lanes that are separated from traffic. However, when separated lanes are lacking, bicyclists, regardless of gender, seem to prefer low-volume residential streets without bicycle lanes over high volume roads with on-street bicycle lanes. 46 A study of consumer behavior in Portland, Oregon, for example, recently reported that for every mile of high-traffic streets within a half-mile of an establishment, the number of bicyclists frequenting that establishment dropped by 1%. 47
A recent European study probed the limitations of increasing bicycle use by increasing bicycle facilities and “data from 167 European cities suggests that the length of cycling infrastructures is associated with a cycling mode share up to a rate of 24.7%, in which 1 in every 4 citizens would choose the bicycle for their daily commuting.” 48 Beyond 24.7%, the availability of bicycle facilities lose their relationship with the percentage of people riding bikes. 49 In the context of the United States, no city approaches 24.7% mode share with the possible exception of Davis, California, which has had a bicycle commuter mode share near 20% in the past. This study suggests that an increase in the amount of bicycle facilities – in addition to providing “innovative” bicycle infrastructure is an important step towards increasing bicycle use in the United States.
ADVANCING UNDERSTANDING: THE NEED FOR BETTER PEDESTRIAN & BICYCLE NETWORK DATA
Data on bicycling and walking networks is not well-defined, and systems for reporting on those networks are not commonplace or optimized. Often, nonprofit organizations such as the People for Bikes’ Green Lane Project or the League of American Bicyclists’ Benchmarking Project collect this data.
The Benchmarking Report was created to help spur better data collection and systems. In the last decade, several difficulties have been associated with tracking changes to the built environment using a survey methodology. Two challenges that have persisted are:
For example, some cities likely have reported centerline miles over time, and others have reported lane miles. Centerline miles are calculated by measuring down the center of all lanes of traffic in a roadway, while lane miles are calculated by multiplying the centerline measurement by the number of through lanes in a roadway. These measurements are not interchangeable, as lane miles are often at least twice the length of centerline miles. Also, quality and usability of infrastructure, such as bicycle lane widths, sidewalk or bike lane pavement quality, and curb ramp types are rarely captured.
One instance is the featuring of “sharrows,” or shared lane markings, as innovative bicycle facilities in most editions of the Benchmarking Report. Sharrows were not mentioned in the initial 2007 Benchmarking Report, and in 2010, only 20 of the 50 large cities reported using them. By the 2014 Benchmarking Report, 45 of the 46 large cities citing any bicycling infrastructure reported they used sharrows. This shows fairly rapid adoption of an “innovative” facility. The successful increase of sharrows is likely due at least in part to their official inclusion in the Manual on Uniform Traffic Control Devices 50 and their low cost. However, a 2016 report found that sharrows do not increase bicycling and do not have a positive safety effect on bicycling. 51
In a best-case scenario for publicly accessible data, data would exist in uniform, government-maintained, publicly accessible systems. One possibility for Benchmarking Report data on infrastructure might be city- or state- maintained Geographic Information System (GIS) databases structured around the FHWA’s Model Inventory of Roadway Elements (MIRE). This would help ensure all cities and states are reporting data in a common format.
The long-term benefits of moving to GIS and MIRE-based monitoring of roadways could include easier comparisons between places, the development of standard tools based on GIS and MIRE elements, and a transparent mechanism for incorporating new bicycle and pedestrian facilities as roadway elements for data collection.
As an alternative to government-provided data, crowdsourced data on bicycling and walking infrastructure is becoming available through initiatives such as OpenStreetsMap and mobile applications such as Lanespotter. If cities and states were to rely on various providers of this type of roadway data, then it is possible that there would continue to be data collection issues related to lane mile versus centerline mile measurement and the classification of different types of bicycle and pedestrian facilities.
Private companies also may develop mapping datasets equivalent to or better than city- and state-maintained roadway datasets. Governments are already looking to private companies for data such as bicycle use (e.g., Strava) and other modes of travel (e.g., Sidewalk Labs or Inrix). Private mapping companies are actively developing high-quality, detailed maps to serve automated vehicle deployment, safety, and logistics. This has potential to provide very high-quality data on roadway conditions based on sensors equipped to automated and/or connected vehicles, but it is not clear who would have access to this data and at what the price.
EMBRACING EQUITY: CONSIDERING WHO IS SERVED BY INFRASTRUCTURE & WHY IT IS PROVIDED
Physical infrastructure cannot be untied from social infrastructure. The development of specialized bicyclist and pedestrian infrastructure and its prevalence in cities, towns, and rural areas can be tracked in projects like the Benchmarking Report. It is much harder to codify, track, and report on the social infrastructure that affects the acceptance of bicycling and walking infrastructure by communities or affects the use of that infrastructure when provided.
As biking infrastructure has expanded, creators have faced questions about who it serves and why it is being created now. This “bikelash” is not necessarily motivated by the “windshield perspective” of motorists who see their right to the road being limited by sharing the road with non-motorists. Instead these questions about who benefits from bicycle infrastructure are raised in some instances because of human experiences with power, particularly as expressed through infrastructure, which for some, has a history of dividing communities rather than serving their interests. To understand community resistance to bicycling infrastructure, or how bicycling infrastructure may not in itself serve a community’s needs, many turn to the concept of intersectionality.
Intersectionality is a concept that seeks to understand the interplay of identities and inequalities, so experiences of people are more fully understood. 54 In one formulation, its methodology is “asking the other question.” 55 As an example, data suggest that women are less likely to bike than men. Research shows the best way to get women on bicycles is to provide them with safe, comfortable, convenient bicycling facilities that are physically separated and protected from motor vehicles or low-speed, low- traffic residential streets (such as bicycle boulevards) where they can avoid the stress of fighting motor vehicle traffic. 56 However, this analysis and solution may miss the experiences of minority women, women with children, older women, younger women, or any other non-gendered trait that affects the experience of a woman considering whether to ride a bike. The insight of intersectionality is that people experience privilege and oppression in a variety of ways, and one part of their identity does not fully explain their reaction or feelings about an issue.
In an interview with Melody Hoffmann, author of “Bike Lanes Are White Lanes, 57 for Greenroom Magazine, Hoffman gave an example of how historical power dynamics could slow efforts to improve biking and walking:
“When [the Minneapolis Bicycle Coalition] did Open Streets on Lake Street, they got permits to close down the street. But there were some Latinx community groups that were kind of angry that the coalition got their streets closed, because the other groups had been trying to get their festivals on Lake Street, but they could never get it closed. And so it looks like, ‘the powerful white people on bikes get whatever they want, and the Latinxs don’t.’ … {T]he Coalition’s director worked with those community groups and gave them some tips and tricks to get the street closed, which I think have been successful. So, [use] your power and privilege to help communities, because it builds trust and relationships for future projects.” 58
MAKING THE HEALTH CONNECTION: THE SURGEON GENERAL’S CALL TO ACTION TO PROMOTE WALKING & WALKABLE COMMUNITIES
In 2015, then-Surgeon General Vivek Murthy issued Step it Up! The Surgeon General’s Call to Action to Promote Walking and Walkable Communities. 59 The Surgeon General serves as “the Nation’s Doctor,” providing Americans with the best scientific information available on how to improve their health and reduce the risk of illness and injury. 60
Surgeon General Murthy found many scientific reasons for promoting walking and walkable environments to improve health through physical activity. The report included evidence that communities often lack built environments such as sidewalks for walking. For example, “In 2012, more than three out of every 10 people aged 16 years or older reported that no sidewalks existed along any street in their neighborhood.” 61 In addition, the report noted, “Physical environments—such as a lack of sidewalks and crosswalks, poor lighting, streets with high-speed traffic, and poorly timed crossing signals—also contribute to increased pedestrian risk.” 62
Land use decisions that place destinations farther apart were also found to be contributing to a lack of walking. The Surgeon General found that “[t]he distance between home and school is strongly associated with whether students walk to school.” 63 The distance between home and school is important because, while 35% of students who live less than a mile from school walk or bike to school on most days, only 2% of students living 2 miles from school usually bike or walk to school. 64
To address these concerns, the Surgeon General’s Call to Action laid out five goals:
These five goals, but particularly Goal 2 (“Design communities that make it safe and easy to walk for people of all ages and abilities.), promote the need for infrastructure interventions that promote walking. 65 These infrastructure interventions include the types of specialized or innovative infrastructure discussed in this section and the infrastructure that lowers traffic speeds for many of the same reasons discussed earlier in this section. The Call to Action also noted, “No current surveillance system routinely and comprehensively monitors local neighborhood features of a walkable community.” 66
The Alliance for Biking and Walking. Bicycling and Walking in the United States: 2007 Benchmarking Report at p. 66. Available at https://bikeleague. org/sites/default/files/2007BenchmarkingReport.pdf.
National Highway Traffic Safety Administration. (2013, October). 2012 National Survey of Bicyclist and Pedestrian Attitudes and Behavior, Volume 2: Findings Available at http://www.nhtsa.gov/staticfiles/nti/pdf/811841b.pdf.
National Association of City Transportation Officials. Urban Street Design Guide: Leading Pedestrian Interval. Adapted from Urban Street Design Guide, Island Press (October 2013). Available at https://nacto.org/publication/urban-street-design-guide/intersection-design-elements/traffic-signals/leading-pedestrian-interval/#:~:text=LPIs%20should%20give%20pedestrians%20a,the%20crossing%20distance%20is%20long.
PEDSAFE. Federal Highway Administration. Pedestrian Safety Guide and Countermeasure Selection System–Leading Pedestrian Interval. Available at http://www.pedbikesafe.org/PEDSAFE/countermeasures_detail.cfm?CM_NUM=12.
M. Knopp. Federal Highway Administration Policy Memorandum, U.S. DOT. Interim Approval 21—Rectangular Rapid-Flashing Beacons at Crosswalks (March 20, 2018). Available at https://mutcd.fhwa.dot.gov/resources/interim_approval/ia21/index.htm.
Alta Planning + Design. Rescission of Interim Approval of Rectangular Rapid Flashing Beacons (Updated March 20, 2018). Available at https:// altaplanning.com/news/fhwa-rescission-interim-approval-rectangular-rapid-flashing-beacons.
PEDSAFE. Federal Highway Administration. Pedestrian Safety Guide and Countermeasure Selection System–Rectangular Rapid Flashing Beacon. Available at http://www.pedbikesafe.org/PEDSAFE/countermeasures_detail.cfm?CM_NUM=12.
America Walks. Pedestrian Hybrid or HAWK Beacon. Available at http://americawalks.org/pedestrian-hybrid-or-hawk-beacon.
PEDSAFE. Federal Highway Administration. Pedestrian Safety Guide and Countermeasure Selection System–Pedestrian Hybrid Beacon. Available at http://www.pedbikesafe.org/PEDSAFE/countermeasures_detail.cfm?CM_NUM=12.
CTC & Associates Bureau of Highway Operations. Transportation Synthesis Report Research and Library Services. HAWK Pedestrian Signals: A Survey of National Guidance, State Practice, and Related Research (January 29, 2010). Available at http://www.ite.org/uiig/mutcd.asp (discussing a variety of HAWK-like treatments and their compliance with the MUTCD).
PEDSAFE. Federal Highway Administration. Pedestrian Safety Guide and Countermeasure Selection System–Raised Pedestrian Crossings. Available at http://www.pedbikesafe.org/PEDSAFE/countermeasures_detail.cfm?CM_NUM=12.
PEDSAFE. Federal Highway Administration. Pedestrian Safety Guide and Countermeasure Selection System–Raised Intersections. Available at http://www.pedbikesafe.org/PEDSAFE/countermeasures_detail.cfm?CM_NUM=12.
Institute of Transportation Engineers. Designing Walkable Urban Thoroughfares: A Context Sensitive Approach at p. 9. Available at https://ecommerce. org/IMIS/ItemDetail?iProductCode=RP-036A-E.
Federal Highway Administration. Accessible Shared Streets at p. 9. Available at https://www.ssti.us/wp/wp-content/uploads/2018/03/to-upload-fhwahep17096.pdf.
Federal Highway Publication Number: FHWA-HEP-VI-024. Small Towns and Rural Multimodal Networks (December 2016) at pp. 507 and 5-8. Available at https://www.fhwa.dot.gov/environment/bicycle_pedestrian/publications/small_towns/fhwahep17024_lg.pdf.
Federal Highway Administration. Accessible Shared Streets at p. 9. Available at https://www.ssti.us/wp/wp-content/uploads/2018/03/to-upload-fhwahep17096.pdf.
Federal Highway Administration. Accessible Shared Streets at pp. 2-5 to 2-8. Available at https://www.ssti.us/wp/wp-content/uploads/2018/03/to-upload-fhwahep17096.pdf.
Federal Highway Administration. Accessible Shared Streets at p. 9. Available at https://www.ssti.us/wp/wp-content/uploads/2018/03/to-upload-fhwahep17096.pdf.
Pedestrian and Bicycle Information Center. Design Resource Index. Available at http://www.pedbikeinfo.org/planning/facilities_designresourcein- cfm retrieved on 2/19/2018. (chart adapted from data)
M. Knopp. Federal Highway Administration. Interim Approval for Optional Use of Two-Stage Bicycle Turn Boxes (July 17, 2017). Available at https://mutcd.fhwa.dot.gov/resources/interim_approval/ia20/index.htm.
NACTO Urban Bikeway Design Guide, Two-Stage Turn Queue Boxes. Available at https://nacto.org/publication/urban-bikeway-design-guide/ intersection-treatments/two-stage-turn-queue-boxes.
M. Knopp. Federal Highway Administration. Interim Approval for Optional Use of Two-Stage Bicycle Turn Boxes (July 17, 2017). Available at https://mutcd.fhwa.dot.gov/resources/interim_approval/ia20/index.htm.
J. Gilpin, N. Falbo, M. Repsch, and A. Zimmerman. Alta Planning + Design. Lessons Learned: Evolution of the Protected Intersection (December 2015). Available at https://altaplanning.com/wp-content/uploads/Evolution-of-the-Protected-Intersection_ALTA-2015.pdf.
Fehr and Peers. Multimodal Safety Challenges Associated with Designing the Protected ‘Dutch” Intersection. Available at http://www.fehrandpeers.com/ designing-the-protected-intersection.
Massachusetts Department of Transportation. Separated Bike Lane Design Guide – Chapter 4: Intersections. Available at https://mass.gov/files/ documents/2017/10/26/SeparatedBikeLaneChapter4_Intersections.pdf.
Michael Williams. Advisorybikelanes.com.
Alta Planning + Design. Advisory Bike Lanes in North America. Available at https://altaplanning.com/wp-content/uploads/Advisory-Bike-Lanes-In-North-America_Alta-Planning-Design-White-Paper.pdf.
The Alliance for Biking and Walking. Bicycling and Walking in the United States: 2014 Benchmarking Report at p. Available at https://bikeleague.org/sites/default/files/2014BenchmarkingReport.pdf.
Harris, M, C. Reynolds, M. Winters, et al. Injury Prevention (February 14, 2012). Comparing the effects of infrastructure on bicycling injury at intersections and non-intersections using a case-crossover design. Available at http://injuryprevention.bmj.com/content/early/2013/02/13/injuryprev-2012-040561.full.pdf.
Designing for All Ages and Abilities at p. 2. Available at https://nacto.org/wp-content/uploads/2017/12/NACTO Designing-for-All-Ages-Abilities.pdf.
Designing for All Ages and Abilities at p. 6. Available at https://nacto.org/wp-content/uploads/2017/12/NACTO Designing-for-All-Ages-Abilities.pdf. Rachel Aldred. Transportation Research Part A: Policy and Practice 90 (2016). Cycling near misses: Their frequency, impact, and prevention. Available at https://www.sciencedirect.com/science/article/pii/S0965856416303639.
National Transportation Safety Board (July 25, 2017). Reducing Speeding-related Crashes Involving Passenger Vehicles. Safety Study NTSB/SS-17/01 at 11/97. Available at https://ntsb.gov/safety/safety-studies/Documents/SS1701.pdf.
National Transportation Safety Board (July 25, 2017). Reducing Speeding-related Crashes Involving Passenger Vehicles. Safety Study NTSB/SS-17/01 at 10/97. Available at https://ntsb.gov/safety/safety-studies/Documents/SS1701.pdf.
B.C. Tefft. AAA Foundation for Traffic Safety (2011). Impact Speed and a Pedestrian’s Risk of Severe Injury or Death. Available at https:// aaafoundation.org/wp-content/uploads/2018/02/2011PedestrianRiskVsSpeedReport.pdf.
International Transport Forum. OECD. International Traffic Safety Data and Analysis Group. Speed and Crash Risk at p. 5. Available at https://www.itf-oecd.org/sites/default/files/docs/speed-crash-risk.pdf.
Federal Highway Administration Safety, Roadway Safety Professional Capacity Building. Road Safety Fundamentals: Concepts, Strategies, and Practices that Reduce Fatalities and Injuries on the Road. Available at https://rspcb.safety.fhwa.dot.gov/RSF/Unit1.aspx.
National Transportation Safety Board (July 25, 2017). Reducing Speeding-related Crashes Involving Passenger Vehicles. Safety Study NTSB/SS-17/01 at p. 29. Available at https://ntsb.gov/safety/safety-studies/Documents/SS1701.pdf.
National Transportation Safety Board (July 25, 2017). Reducing Speeding-related Crashes Involving Passenger Vehicles. Safety Study NTSB/SS-17/01 at p. 24. Available at https://ntsb.gov/safety/safety-studies/Documents/SS1701.pdf.
National Transportation Safety Board (July 25, 2017). Reducing Speeding-related Crashes Involving Passenger Vehicles. Safety Study NTSB/SS-17/01 at p. 24. Available at https://ntsb.gov/safety/safety-studies/Documents/SS1701.pdf.
National Transportation Safety Board (July 25, 2017). Reducing Speeding-related Crashes Involving Passenger Vehicles. Safety Study NTSB/SS-17/01 at p. 28. Available at https://ntsb.gov/safety/safety-studies/Documents/SS1701.pdf.
U.S. Department of Transportation. Transportation and Health Tool, Office of Policy (October 26, 2015). Traffic Calming to Slow Vehicular Speeds. Available at https://www.transportation.gov/mission/health/Traffic-Calming-to-Slow-Vehicle-Speeds.
National Association of City Transportation Officials. Urban Street Design Guide: Speed Reduction Mechanisms. Adapted from Urban Street Design Guide, Island Press (October 2013). See also Federal Highway Course on Bicycling and Pedestrian Transportation. Lesson 11, Traffic Calming. Available at https://safety.fhwa.dot.gov/ped_bike/univcourse/pdf/swless11.pdf.
Dill, J., Handy, S., & Pucher, J. (2013). Report funded by the Robert Wood Johnson Foundation. How to Increase Bicycling for Daily Travel. Available at http://activelivingresearch.org/files/ALR_Brief_ DailyBikeTravel_May2013.pdf.
Dill, J., Handy, S., & Pucher, J. (2013). Report funded by the Robert Wood Johnson Foundation. How to Increase Bicycling for Daily Travel. Available at http://activelivingresearch.org/files/ALR_Brief_ DailyBikeTravel_May2013.pdf.
Dill, J., Handy, S., & Pucher, J. (2013). Report funded by the Robert Wood Johnson Foundation. How to Increase Bicycling for Daily Travel. Available at http://activelivingresearch.org/files/ALR_Brief_ DailyBikeTravel_May2013.pdf.
Dill, J., Handy, S., & Pucher, J. (2013). Report funded by the Robert Wood Johnson Foundation. How to Increase Bicycling for Daily Travel. Available at http://activelivingresearch.org/files/ALR_Brief_ DailyBikeTravel_May2013.pdf.
Clifton, K., Muhs, C., Morrissey, S., et al. (2013). Examining Consumer Behavior and Travel Choices: A Focus on Cyclists and Pedestrians. Available at https://nacto.org/docs/usdg/consumer_behavior_and_travel_choices_clifton.pdf.
Barcelona Institute for Global Health (IS Global). European Cities Could Avoid Up to 10,000 Premature Deaths by Expanding Cycling Networks (January 15, 2018). Available at https://www.isglobal.org/en/new/-/asset_publisher/JZ9fGljXnWpI/content/las-ciudades-europeas-podrian-evitar-has-ta-10-000-muertes-prematuras-ampliando-las-redes-de-carriles-bici.
F. O’Sullivan. City Lab. More Bike Lanes Could Save Up to 10,000 Lives a Year in Europe (January 22, 2018). Available at https://www.citylab.com/transportation/2018/01/more-bike-lanes-could-save-up-to-10000-european-lives/551111.
Virginia Cycling Federation. New MUTCD Released—Now with Sharrows! (December 16, 2009). Available at https://vabike.org/new-mutcd-released-now-with-sharrows.
E. Jaffe. City Lab. Some Bike Infrastructure Is Worse Than None at All (February 5, 2016). Available at https://www.citylab.com/solutions/2016/02/sharrow-safety-bike-infrastructure-lane-chicago/460095/.
The Untokening. Untokening 1.0 Principles of Mobility Justice at p. 9. Available at https://static1.squarespace.com/static/579398799f7456b10f43afb0/t/5a08797553450af- 07cb310dd/1510504821822/Untokening+1.0+web.pdf.
N. Doerner. Better Bike Share Partnership. Active Transportation Intersectionality and the Importance of Listening (June 7, 2007). Available at http://betterbikeshare.org/2016/06/07/active-transportation-intersectionality-importance-listening.
T. Calasanti and S. Giles. American Society on Aging. The Challenge of Intersectionality. Available at http://www.asaging.org/blog/challenge-intersectionality. (“Kimberlé Crenshaw (1989), who coined intersectionality to explain the interplay of inequalities that could exclude groups from single-inequality analysis.”)
A. Kaijser and A. Kronsell. Environmental Politics, 23:3, 417-433 (2014). Climate Change through the Lens of Intersectionality at p. 420, “Intersectional methodology can be as straightforward as Matsuda’s ‘asking the other question’ approach. When I see something that looks racist, I ask, ‘Where is the patriarchy in this?’ When I see something that looks sexist, I ask, ‘Where is the heterosexism in this?’ When I see something that looks homophobic, I ask, ‘Where are the class interests in this?’ (Matsuda 1991, p. 1189)” Available at https://www.tandfonline.com/doi/pdf/10.1080/09644016.2013.835203.
Garrard, J., Dill, J., Handy, S. (2012). Women and Cycling. In Pucher, J., Buehler, R. (Eds.), City Cycling (211-234). Cambridge, MA: MIT Press.
M. Hoffman. Bike Lanes Are White Lanes: Bicycle Advocacy and Urban Planning (July 2016). Available at http://www.nebraskapress.unl.edu/university-of-nebraska-press/9780803276789.
S. Yeboah-Sampong. Green Room Magazine. Are Bike Lanes for White People? (November 16, 2016). Available at http://www.greenroommagazine.com/blog/2016/10/25/are-bike-lanes-really-white-lanes.
U.S. Department of Health and Human Services. Step It Up! The Surgeon General’s Call to Action to Promote Walking and Walkable Communities (September 9, 2015). Available at https://www.surgeongeneral.gov/library/calls/walking-and-walkable-communities/index.html.
U.S. Department of Health and Human Services. About the Office of the Surgeon General. Available at https://www.surgeongeneral.gov/about/index.html.
U.S. Department of Health and Human Services. Step It Up! The Surgeon General’s Call to Action to Promote Walking and Walkable Communities (September 9, 2015) at p. 14. Available at https://www.surgeongeneral.gov/library/calls/walking-and-walkable-communities/index.html.
U.S. Department of Health and Human Services. Step It Up! The Surgeon General’s Call to Action to Promote Walking and Walkable Communities (September 9, 2015) at p. 14. Available at https://www.surgeongeneral.gov/library/calls/walking-and-walkable-communities/index.html.
U.S. Department of Health and Human Services. Step It Up! The Surgeon General’s Call to Action to Promote Walking and Walkable Communities (September 9, 2015) at p. 15. Available at https://www.surgeongeneral.gov/library/calls/walking-and-walkable-communities/index.html.
National Center for Safe Routes to School. How Children Get to School: School Travel Patterns from 1969 to 2009 (2011). Available at http://www.com/Documents/Research%20Reports/NHTS%20School%20Travel%20Report%202011.pdf.
U.S. Department of Health and Human Services. Step It Up! The Surgeon General’s Call to Action to Promote Walking and Walkable Communities (September 9, 2015) at p. 33. Available at https://www.surgeongeneral.gov/library/calls/walking-and-walkable-communities/index.html.
U.S. Department of Health and Human Services. Step It Up! The Surgeon General’s Call to Action to Promote Walking and Walkable Communities (September 9, 2015) at p. 43. Available at https://www.surgeongeneral.gov/library/calls/walking-and-walkable-communities/index.html.