The Benchmarking Project has compiled data on bicycling and walking in the United States since a pilot study in 2003.
In 2007, the Thunderhead Alliance released the first Benchmarking Report on bicycling and walking in the United States with data from all 50 states and the 50 most populous U.S. cities. The initial Benchmarking Report highlighted available national data on bicycling and walking, and used surveys distributed through Alliance member organizations to collect information that was not otherwise available about issues such as state and city policies, funding sources, and education efforts.
By the second edition of the Benchmarking Report (2010), the Thunderhead Alliance – originally named after the 1996 meeting of 12 leaders of bicycling and walking advocacy groups at the Thunderhead Ranch in Wyoming – had rebranded as the Alliance for Biking and Walking (Alliance) to better reflect its work and growth, to 160-member groups.
Beginning with the 2010 Benchmarking Report, the Alliance began publishing the report biennially with updates in 2012, 2014, and 2016. Over five editions, the Benchmarking Report expanded to include data on additional cities – 17 mid-sized cities were added in 2014 – and on evolving changes in bicycling and walking practices over time. As an example, bike share systems were first reported on in 2012, when five cities had bike share systems.

The 2018 Benchmarking Report on Bicycling and Walking is the sixth edition and the first published by the League of American Bicyclists. It aims to update data and analyses found in the five previous editions.
The 2018 Benchmarking Report follows the format adopted by the Alliance for the 2016 Benchmarking Report and attempts to include all cities referenced in the report since 2014.
The League of American Bicyclists (League) is a nonprofit bicycle advocacy organization with more than 350 bicycle and pedestrian advocacy member groups. Founded in 1880, the League was instrumental in the Good Roads movement that advocated for paved roads. In 2012, the League began working cooperatively with the Alliance on a shared survey of state departments of transportation.
When the Alliance ceased operations in 2016, its Board of Directors voted to provide the League with all Alliance intellectual property, including the Benchmarking Report. The League shares many of the goals of the Alliance, whose mission was “to create, strengthen, and unite state/ provincial and local bicycle and pedestrian advocacy organizations.” 2 For more information on similarities and differences between the League and Alliance, please see Part III: Make Your Case–Engaged Public.
In taking on the Benchmarking Report, the League continued data collection and reporting in a manner that allows longitudinal comparisons with past Benchmarking Reports. These efforts included:
- Reviewing the table of contents from each of the prior Benchmarking Reports,
- Reviewing the bibliography of each of the prior Benchmarking Reports,
- Reviewing every data source for charts used in the website bikingandwalkingbenchmarks.org, and
- Reviewing use of benchmarking city survey data from the 2016 and 2014 Benchmarking Reports.
Nevertheless, the 2018 Benchmarking Report contains several changes to its surveys and data collection methods. Those changes reflect the League’s ongoing commitment to its Bicycle Friendly America Program, which has collected data on cities since 1995 and states since 2008. To avoid confusion and minimize data collection burden, benchmarking survey questions were integrated into the League’s existing Bicycle Friendly Community program based on past use. Prior to taking on the Benchmarking Report, the League conducted a review of the Bicycle Friendly State survey in 2016, receiving more than 700 comments from state departments of transportation, state bicycling advocacy organizations, and national biking and walking advocacy organizations.
The League is excited by the opportunity to continue to integrate Benchmarking Report data collection into the Bicycle Friendly America program. The Bicycle Friendly America program has a broad reach, with over 800 communities applying for Bicycle Friendly Community recognition since 2002. This includes 47 of the 50 most populous cities in the United States. By aligning benchmarking survey data collection with this existing and popular program, the League maximizes its data collection ability and minimizes the work of city staff needed for participation in both programs.

Project Goals & Objectives
The goal of the Benchmarking Report is to document, measure, and evaluate conditions for bicycling and walking in the United States. By providing a broad collection of data from the federal government and survey data from state and city governments, the Benchmarking Report provides data and analyses that can support organizations, public officials, planners, engineers, and educators who work to improve communities for people who bike and walk.
The Benchmarking Report began with the first three objectives below. Two more objectives were added in the 2014 report. In the 2018 report, the League continues to embrace the five objectives promoted by the Alliance.
The following objectives guide the development and structure of the Benchmarking Report on Biking and Walking in the United States:
OBJECTIVE 1 » PROMOTE DATA COLLECTION & AVAILABILITY
The Benchmarking Report seeks to make bicycling and walking data easier to find and analyze in two ways: 1) by compiling and analyzing data from federal and/or other national sources of data, and 2) by collecting data through surveys where data are otherwise unavailable.
In the 2018 Benchmarking Report, Advancing Understanding sections highlight areas where data related to bicycling and walking efforts can be improved.
OBJECTIVE 2 » MEASURE PROGRESS & EVALUATE RESULTS
The Benchmarking Report provides data in a manner suitable for longitudinal analyses and comparative research. More than 100 data tables and charts in Part IV: Show Your Data summarize such information at the national, state, and city levels, providing the foundation needed for users to understand changes in biking, walking, public health, and efforts to improve biking and walking in the United States.
Where data are available, the Benchmarking Report provides comparisons over time so users can quickly understand any differences. When multiple types of data on a subject are available, such as rates of bicycling and walking trips, data from more than one source are provided to enable comparisons.
Efforts to promote bicycling and walking continue to evolve and have changed markedly over the course of the Benchmarking Report’s six editions. The League expects more data on national, state, and city efforts to be added later to reflect any changes. Successes such as widespread adoption of bicycle and pedestrian master plans among large cities provide opportunities to strengthen the League’s data collection and understanding around these now common activities, all of which will make the report a continuing valuable resource for users. At the same time, the Benchmarking Report can be a way to enhance partnerships with the expanding collection of groups organized around bicycling and walking, including many that did not exist or have expanded since the time of the Benchmarking Report’s initial publication in 2007.
OBJECTIVE 3 » SUPPORT EFFORTS TO INCREASE BICYCLING & WALKING
The Benchmarking Report compiles data, research, and tools that help make the case for investing in improvements for bicycling and walking. Its information and analysis illustrate current conditions, expand on public knowledge, highlight new initiatives, and identify remaining challenges. Through city-to-city and state-to-state comparisons, the project helps partners, public officials, and agency staff set and track goals to increase bicycling and walking in their communities. The accessible tables and graphics in the Benchmarking Report increase the user’s ability to incorporate current information into their work.
OBJECTIVE 4 » MAKE THE HEALTH CONNECTION
The Benchmarking Report works with the Centers for Disease Control and Prevention (CDC) to highlight the connection between bicycling and walking, and the management and prevention of chronic diseases such as asthma, diabetes, hypertension, and obesity. Data from the CDC’s Behavioral Risk Factor Surveillance System (BRFSS) has been included in the Benchmarking Report since the first edition in 2007.
In the 2018 Benchmarking Report, Making the Health Connection topics are intended to highlight public health efforts that may serve as models for bicycling and walking promotion or otherwise discuss the roles that bicycling and walking play in public health.
OBJECTIVE 5 » STRENGTHEN THE NETWORK OF PARTNERS FOR BIKING & WALKING
The Benchmarking Report strengthens the growing network of bicycle and pedestrian organizations by helping to identify talking points and best practices that support their work. The many graphics throughout the report illustrate data at the city, state, and national levels to address interests and goals of diverse audiences engaged with bicycling and walking partners.
Organizations can share these ready-made graphics, including citations to additional research and data sources, to provide educational awareness to decision makers, public agency staff, and other stakeholders.

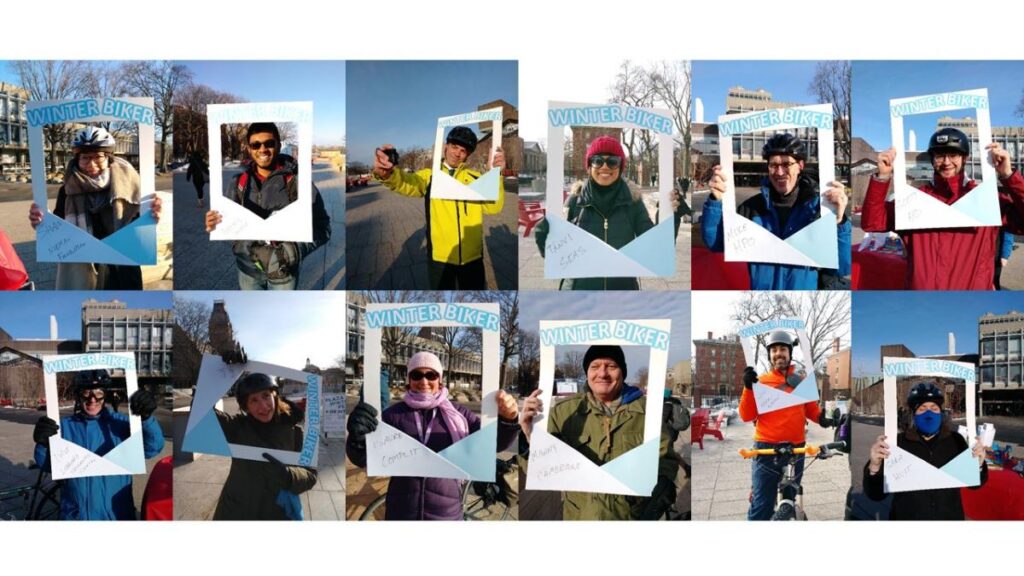
Winter Biker Selfies, photo courtesy of Harvard University