STUDY AREAS & DATA COLLECTION

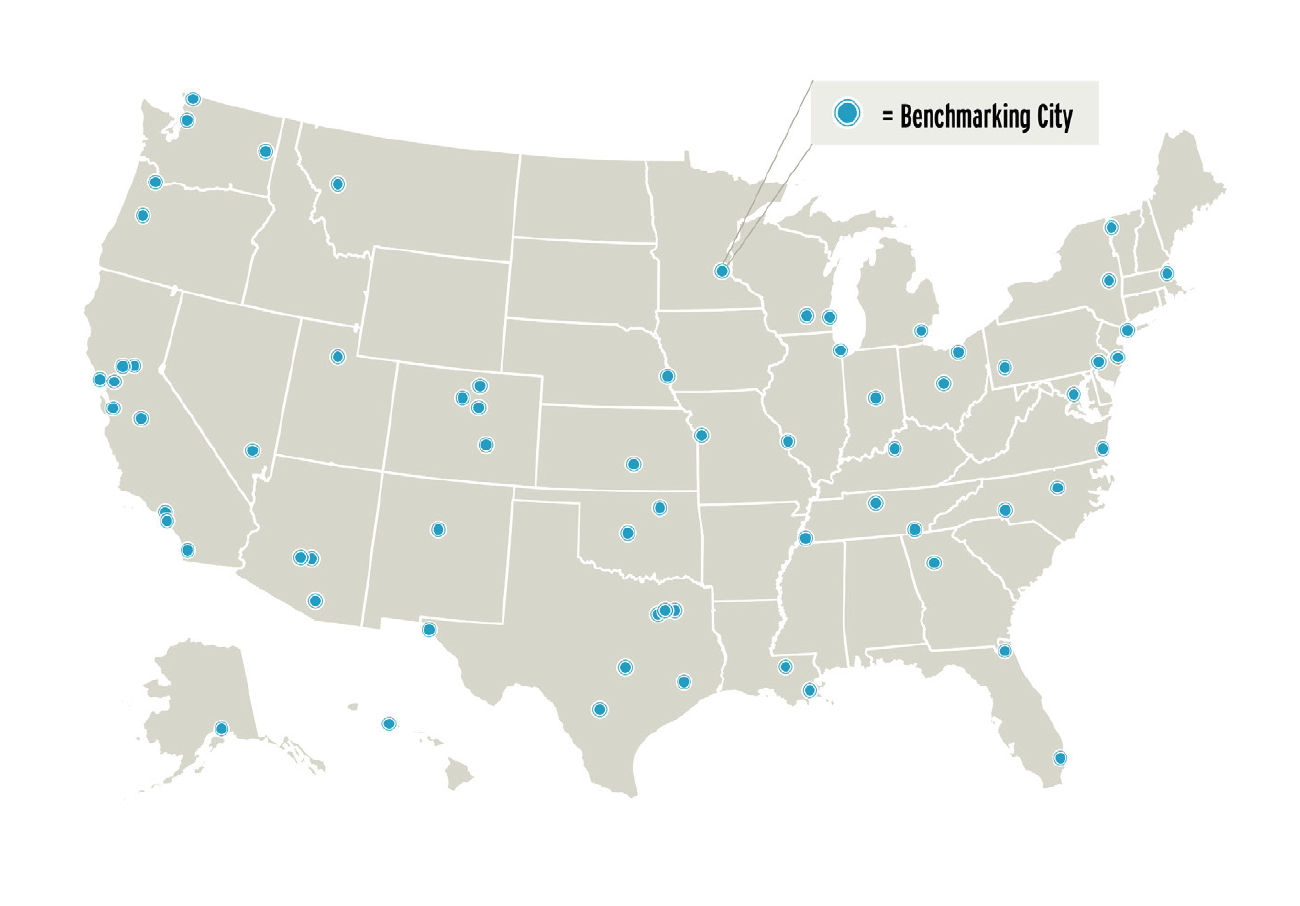
The Benchmarking Report began by collecting and reporting data on all 50 states and the 50 most populated U.S. cities. The League determined city populations for this report by using 2016 American Community Survey (ACS) five-year population estimates at the place level. 3

The cities studied for this project have shifted over the years, due to changing populations and the addition of small and mid- sized cities to the 2014 Benchmarking Report. Raleigh and Wichita have replaced New Orleans and Honolulu, which were in the original 50 most populous cities included in earlier reports. Raleigh was added to the 2010 Benchmarking Report due to the significant population decrease in New Orleans following Hurricane Katrina. Wichita is among the 50 most populous cities as of the 2014 report. Although New Orleans and Honolulu are no longer among the 50 largest cities, they are included in the report (along with select cities with smaller populations first included in 2014) to take advantage of the already- collected data. Throughout this publication, Washington, DC is discussed as one of the 50 most populous cities, rather than as a state, due to its geographic compactness and urbanized nature.

A list of included cities and their populations can be found in Chapter V: Appendix.

FIGURE 1.5.1 – STUDY AREA LOCATIONS

Unless otherwise noted, all averages in this report are un-weighted simple averages. Averages of the states are calculations only of the 50 United States, not any territories or the District of Columbia.

When states are referred to regionally, they are grouped into the regions below. These regions are also used by the League of American Bicyclists’ Bicycle Friendly State program.

FIGURE 1.5.2 – STATES BY REGION

SELECTED BENCHMARKS

Public officials and partners can use the Benchmarking Report as an evaluation tool to consistently report on both input and output performance measures.

  • INPUT PERFORMANCE MEASURES are efforts within the control of public decision makers, such as whether the community has adopted a bicycle and pedestrian master plan. The Benchmarking City and State Survey Tools are the primary way that input performance measures are collected. Where feasible, survey data is compared to publicly available data to report on input performance measures.
  • OUTPUT PERFORMANCE MEASURES are observable data on bicycling and walking. The Benchmarking Report primarily relies on the compilation of federal datasets to report on output performance measures, such as rates of biking and walking to work.

By reporting both input and output performance measures over time, the Benchmarking Report can be used as an evaluation tool to determine increases in bicycling and walking levels, improvements in public health, and increased safety of bicyclists and pedestrians. The longitudinal data collected in the Benchmarking Reports allow the use of data to compare communities in various ways, including documentation of progress in efforts and outcomes related to bicycling and walking.

The 2018 Benchmarking Report evaluates cities, states, and organizations based on output variables listed in Table 1 and categorized as levels of bicycling and walking, public health, safety, and funding. Input variables (Table 2) are broadly categorized as administrative and legislative priorities, administration and enforcement capacity, advocacy capacity, and implementation. These variables were selected based on use in previous Benchmarking Reports and the quality of available data.

FIGURE 1.5.3 – OUTPUT BENCHMARKS
FIGURE 1.5.4 – INPUT BENCHMARKS

All sources used for the reported benchmarks are cited in Chapter IV: Show Your Data and referenced in Chapter V: Appendix.

» NATIONAL DATA SOURCES

Whenever possible, the project team collected data for this report from uniform national sources managed by public agencies and organizations. All sources are identified throughout the text and with tables and graphics as relevant. See the Appendix for a summary explanation of each dataset collected. As much as possible, the League used the most recent available data in this report. Due to the lag between federal data releases and publication, the most recent year for most federal data is 2016 throughout this report.

In some cases, data come from independent studies. Full citations for these studies are included as footnotes.

» STATE & CITY SURVEYS

In addition to national data sources, the Benchmarking Report has included data from state and local surveys since its inception. These surveys have sought to gather data not otherwise available and to report results, so states and cities might better compare their efforts.

For the 2018 Benchmarking Report, the report production and survey responsibilities shifted from the Alliance to the League. The League has been involved with the Benchmarking Report since 2013, when the organizations began to collaborate on a single state survey that could be used for both the Benchmarking Report and the League’s Bicycle Friendly State Program. The 2018 Benchmarking Report continued this alignment by following a similar process for the city survey used by the Benchmarking Report. The League distributed the latter through its Bicycle Friendly Community Program, in which 47 of the 50 largest cities had previously participated. Where cities did not provide updated data, the most recently available data from either the last Benchmarking survey or their most recent Bicycle Friendly Community application were used. A full list of sources used for city survey data is included in the Appendix.

The League collected state survey data between February and June 2017. Surveys were distributed to staff at state departments of transportation and to state advocacy organizations. The Benchmarking Project team  used several email and phone campaigns to solicit responses.  The response rate was high, with 45 of 50 states completing the survey.

Between August 2017 and February 2018, city survey data were collected from staff identified in previous Benchmarking Report survey efforts, contacts from the Bicycle Friendly Community program, and online searches for bicycle and/or pedestrian staff. The project team again obtained responses by using several email and phone campaigns. The response rate was lower than the state survey, with only 26 of the largest cities fully completing  the survey. A full list of the sources used for city survey data is included in the Appendix.

The League entered all data into the Benchmarking Project data collection tool, reviewing and analyzing all data for quality control and insights during the next several months. State and local leaders in the bicycling and walking field across the nation were instrumental in ensuring a high survey response and completion rate.

NOTE: Both state and city surveys collect and report self- reported data from agency staff. While the League has made efforts to verify submitted data where data are publicly available, accuracy cannot be guaranteed.

» LEAGUE MEMBER ORGANIZATION DATA

The League of American Bicyclists has more than 350 state and local member organizations, and maintains their data regarding membership status, location, and other characteristics as a matter of course. The League collected additional data reported in the Benchmarking Report through a SurveyMonkey survey distributed to its organizations to help ensure comparable data to prior reports by the Alliance. That data can be found in Chapter III: Make Your Case Section IX: Engaged Public.


BFB Award Certificate, photo courtesy of Foerstel

Data Corrections

Due to the nature of this project, the Benchmarking Report is continuously updating data as available. Occasionally, more recent data conflict with previously reported findings. This report represents the most accurate data available at the time of writing and includes corrected findings that may or may not differ from those reported in prior report editions.

The most common corrections made are to data submitted in the benchmarking state and city surveys. As respondents change and interpret questions differently, discrepancies occur.

Project Team

In addition to League staff, the Benchmarking project  team includes many individuals who guide the scope of the project and evaluate findings for accuracy and effectiveness. Members of the advisory committee and data review committee are researchers and professionals from diverse specializations and perspectives. The names and affiliations of these distinguished team members are listed at the front of this report.

Footnotes in the Benchmarking Report

Due to the length of the Benchmarking Report, footnote numbers restart in each section to provide easier to follow citations within sections. Sections are the organizational level below chapters throughout the Benchmarking Report.

Snow falls on the campus of the University of North Carolina at Chapel Hill on the first full day of Spring. March 21, 2018. (Jon Gardiner/UNC-Chapel Hill)