IN THIS SECTION, THE BENCHMARKING REPORT LOOKS AT THE CONNECTIONS BETWEEN BICYCLING AND WALKING, AND HEALTH. THIS INCLUDES HOW COMMUNITY ACTIONS TO PROMOTE BICYCLING AND WALKING ARE RELATED TO PHYSICAL ACTIVITY PROMOTION, AS WELL AS THE HEALTH BENEFITS OF BICYCLING AND WALKING.
Making the Case: How Bicycling and Walking Lead to Healthy Communities
- The Case for Physical Activity as an Intervention for Common Chronic Diseases
- The Case for Individualized Marketing as a Health Intervention
- The Case for Bicycle Friendly Communities for Health
Advancing Understanding: Health and Transportation
Embracing Equity: Community Health Depends on Inclusive Actions
HEALTHY COMMUNITIES
WHAT IS A HEALTHY COMMUNITY? According to a CDC publication, “A healthy community is one in which local groups from all parts of the community work together to prevent disease and make healthy living options accessible. 1 ”Another way to think of a healthy community is as the outcome of efforts to promote community health. Community health is the public health concept of “Working at the community level [to promote] healthy living, help[ing] to prevent chronic diseases and bring the greatest health benefits to the greatest number of people in need. 2 ” Together, these definitions suggest healthy communities are focused on processes in addition to outcomes. 3
Creating bikeable and walkable communities is an important way to promote health because bicycling and walking are common activities accessible to most people. As stated in Step it Up! The Surgeon General’s Call to Action to Promote Walking and Walkable Communities 4 , “Walking is an excellent way for most people to increase their physical activity. It is a powerful public health strategy for the following reasons:
- Walking is an easy way to start and maintain a physically active lifestyle.
- Walking is the most common form of physical activity for people across the country.
- Walking can serve many purposes. It can be a way to exercise, have fun, or get to school, work, or other nearby destinations.
- Making walking easier can help communities by improving safety, social cohesion, and local economies and reducing air pollution.”
Bicycling is not as common as walking. According to data from the Bureau of Labor Statistics, 30.4% of Americans walk as an exercise activity on any given day, while only 3.1% ride a bicycle; even with that percentage difference, bicycling is still one of the 10 most commonly reported exercise activities. 5 One recent survey found that “34 % of Americans over the age of three [rode] a bike at least once in the last year.” 6 Bicycling is also an activity accessible to persons with disabilities, and it was reported as one of the five most common physical activities by persons with multiple sclerosis. 7 As with walking, bicycling can serve many purposes and has many, if not all, of the same community benefits as walking.
Bicycling and walking are often referenced together as active transportation. This may include transit as well because transit users spend a median of 19 minutes a day walking to and from transit. 8 These active transportation modes are reported in American Community Survey commute mode share data that will form the basis for a variety of analyses found in this report.
HOW BICYCLING AND WALKING LEAD TO HEALTHY COMMUNITIES
The Case for Physical Activity as an Intervention for Common Chronic Diseases
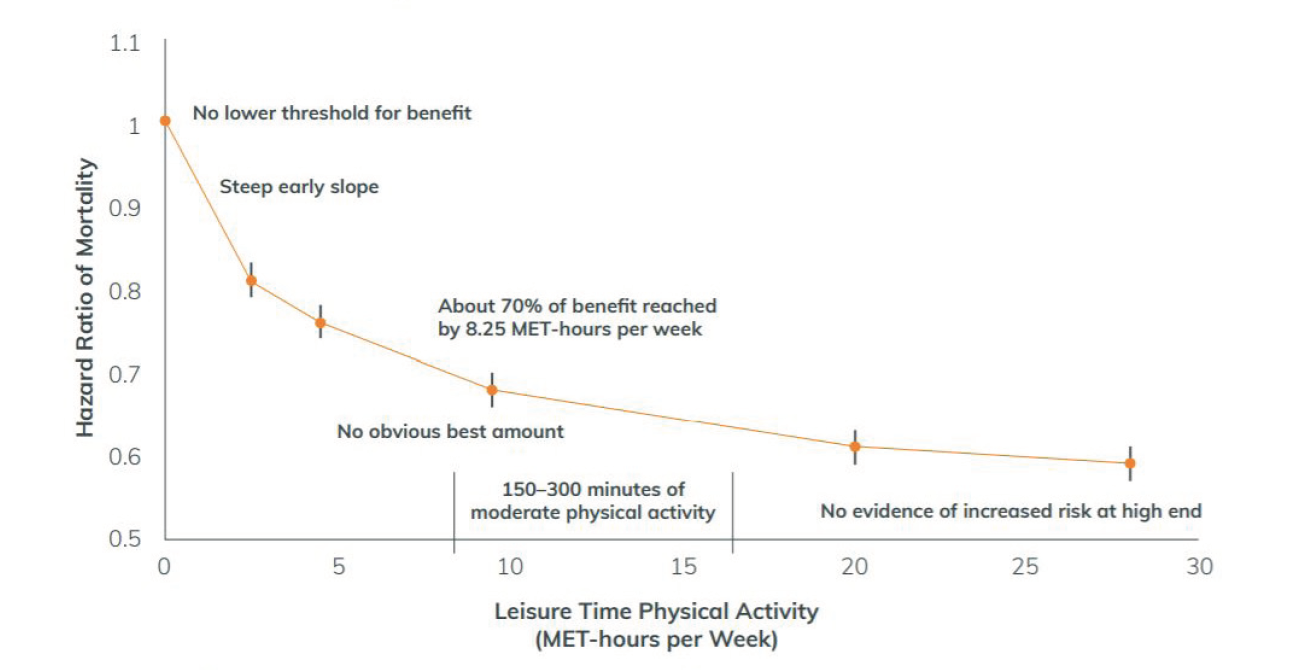
Chronic diseases related to physical inactivity are widespread and increasing. In 2008 and 2018, the Physical Activity Guidelines Advisory Committee reviewed the scientific literature on physical activity and concluded that, compared to inactive adults, the most-active adults had approximately a 30% lower risk of premature death from all causes. 9 Translated to the population level, physical inactivity contributes to an estimated 11% of premature deaths in the United States. These findings have informed the Physical Activity Guidelines for Americans, which recommend adults do at least 150 minutes a week of moderate intensity aerobic activity and avoid prolonged periods of inactivity. 10
Footnote 11
The Benchmarking Report has focused on chronic diseases related to physical inactivity that are monitored by the CDC’s Behavioral Risk Factor Surveillance System (BRFSS). The Benchmarking Report chose five indicators from the BRFSS as benchmarks (references found on following page):
Footnote 12
Data on these chronic disease health indicators can be found in each section of Chapter IV: Show Your Data, although. An examination of health disparities (differences in the prevalence of chronic disease incidence associated with demographic, regional, or other factors) for each of these chronic disease health indicators was outside of the scope of the Benchmarking Report. However, health disparities can be significant for different socioeconomic and demographic groups. The American Public Health Association has urged public health and social justice practitioners, organizations, researchers, and philanthropists to support transportation and land use policies that help address inequities, particularly for communities with low incomes and communities of color experiencing health inequities. 24
The Case for Individualized Marketing as a Health Intervention
The average one-way bicycle commute is 19 minutes, for a total of nearly 40 minutes of bicycling each commute day. 25 –How can we get more people to take advantage of this type of physical activity? One intervention that has demonstrated promise is individualized marketing as a way to provide resources on bicycling to work. Individualized marketing is marketing that is personalized to an individual, often based on data available about that person and with the intent to reflect and appeal to the unique wants and habits of the individual. 26

In addition to community efforts that promote biking and walking, evidence exists that individualized interventions can shift people to non-driving transportation options that involve physical activity. According to consultants at Alta Planning + Design, “Individualized Marketing (IM) programs offer households (typically in a targeted neighborhood) transportation resources and events with the goal of reducing drive-alone trips and encouraging greater use of transportation options. 27 “As some examples, individualized marketing may be conducted through private companies seeking ways to reduce the costs of employee parking, health professionals helping patients become more physically active, or other people advocating for behavior change. At its core, however, individualized marketing is a series of one-to-one messages based on data about a single person.
Some evidence suggests IM is cost-effective. For instance, Oregon Department of Transportation partnered with the Oregon Health Authority to prepare and apply the Integrated Transport and Health Impact Modeling Tool (ITHIM) to measure public health benefits from an IM program called “Drive Less Save More: SouthTown.” Conducted in Corvallis, Oregon, this intervention resulted in a 1.4% increase in walking and a 3.8% reduction in the percentage of people driving alone to work. According to ITHIM estimates, these mode shifts may have resulted in $115,300 in health savings from a decrease in premature mortality and years lived at less than full health. 28
The Case for Bicycle Friendly Communities for Health
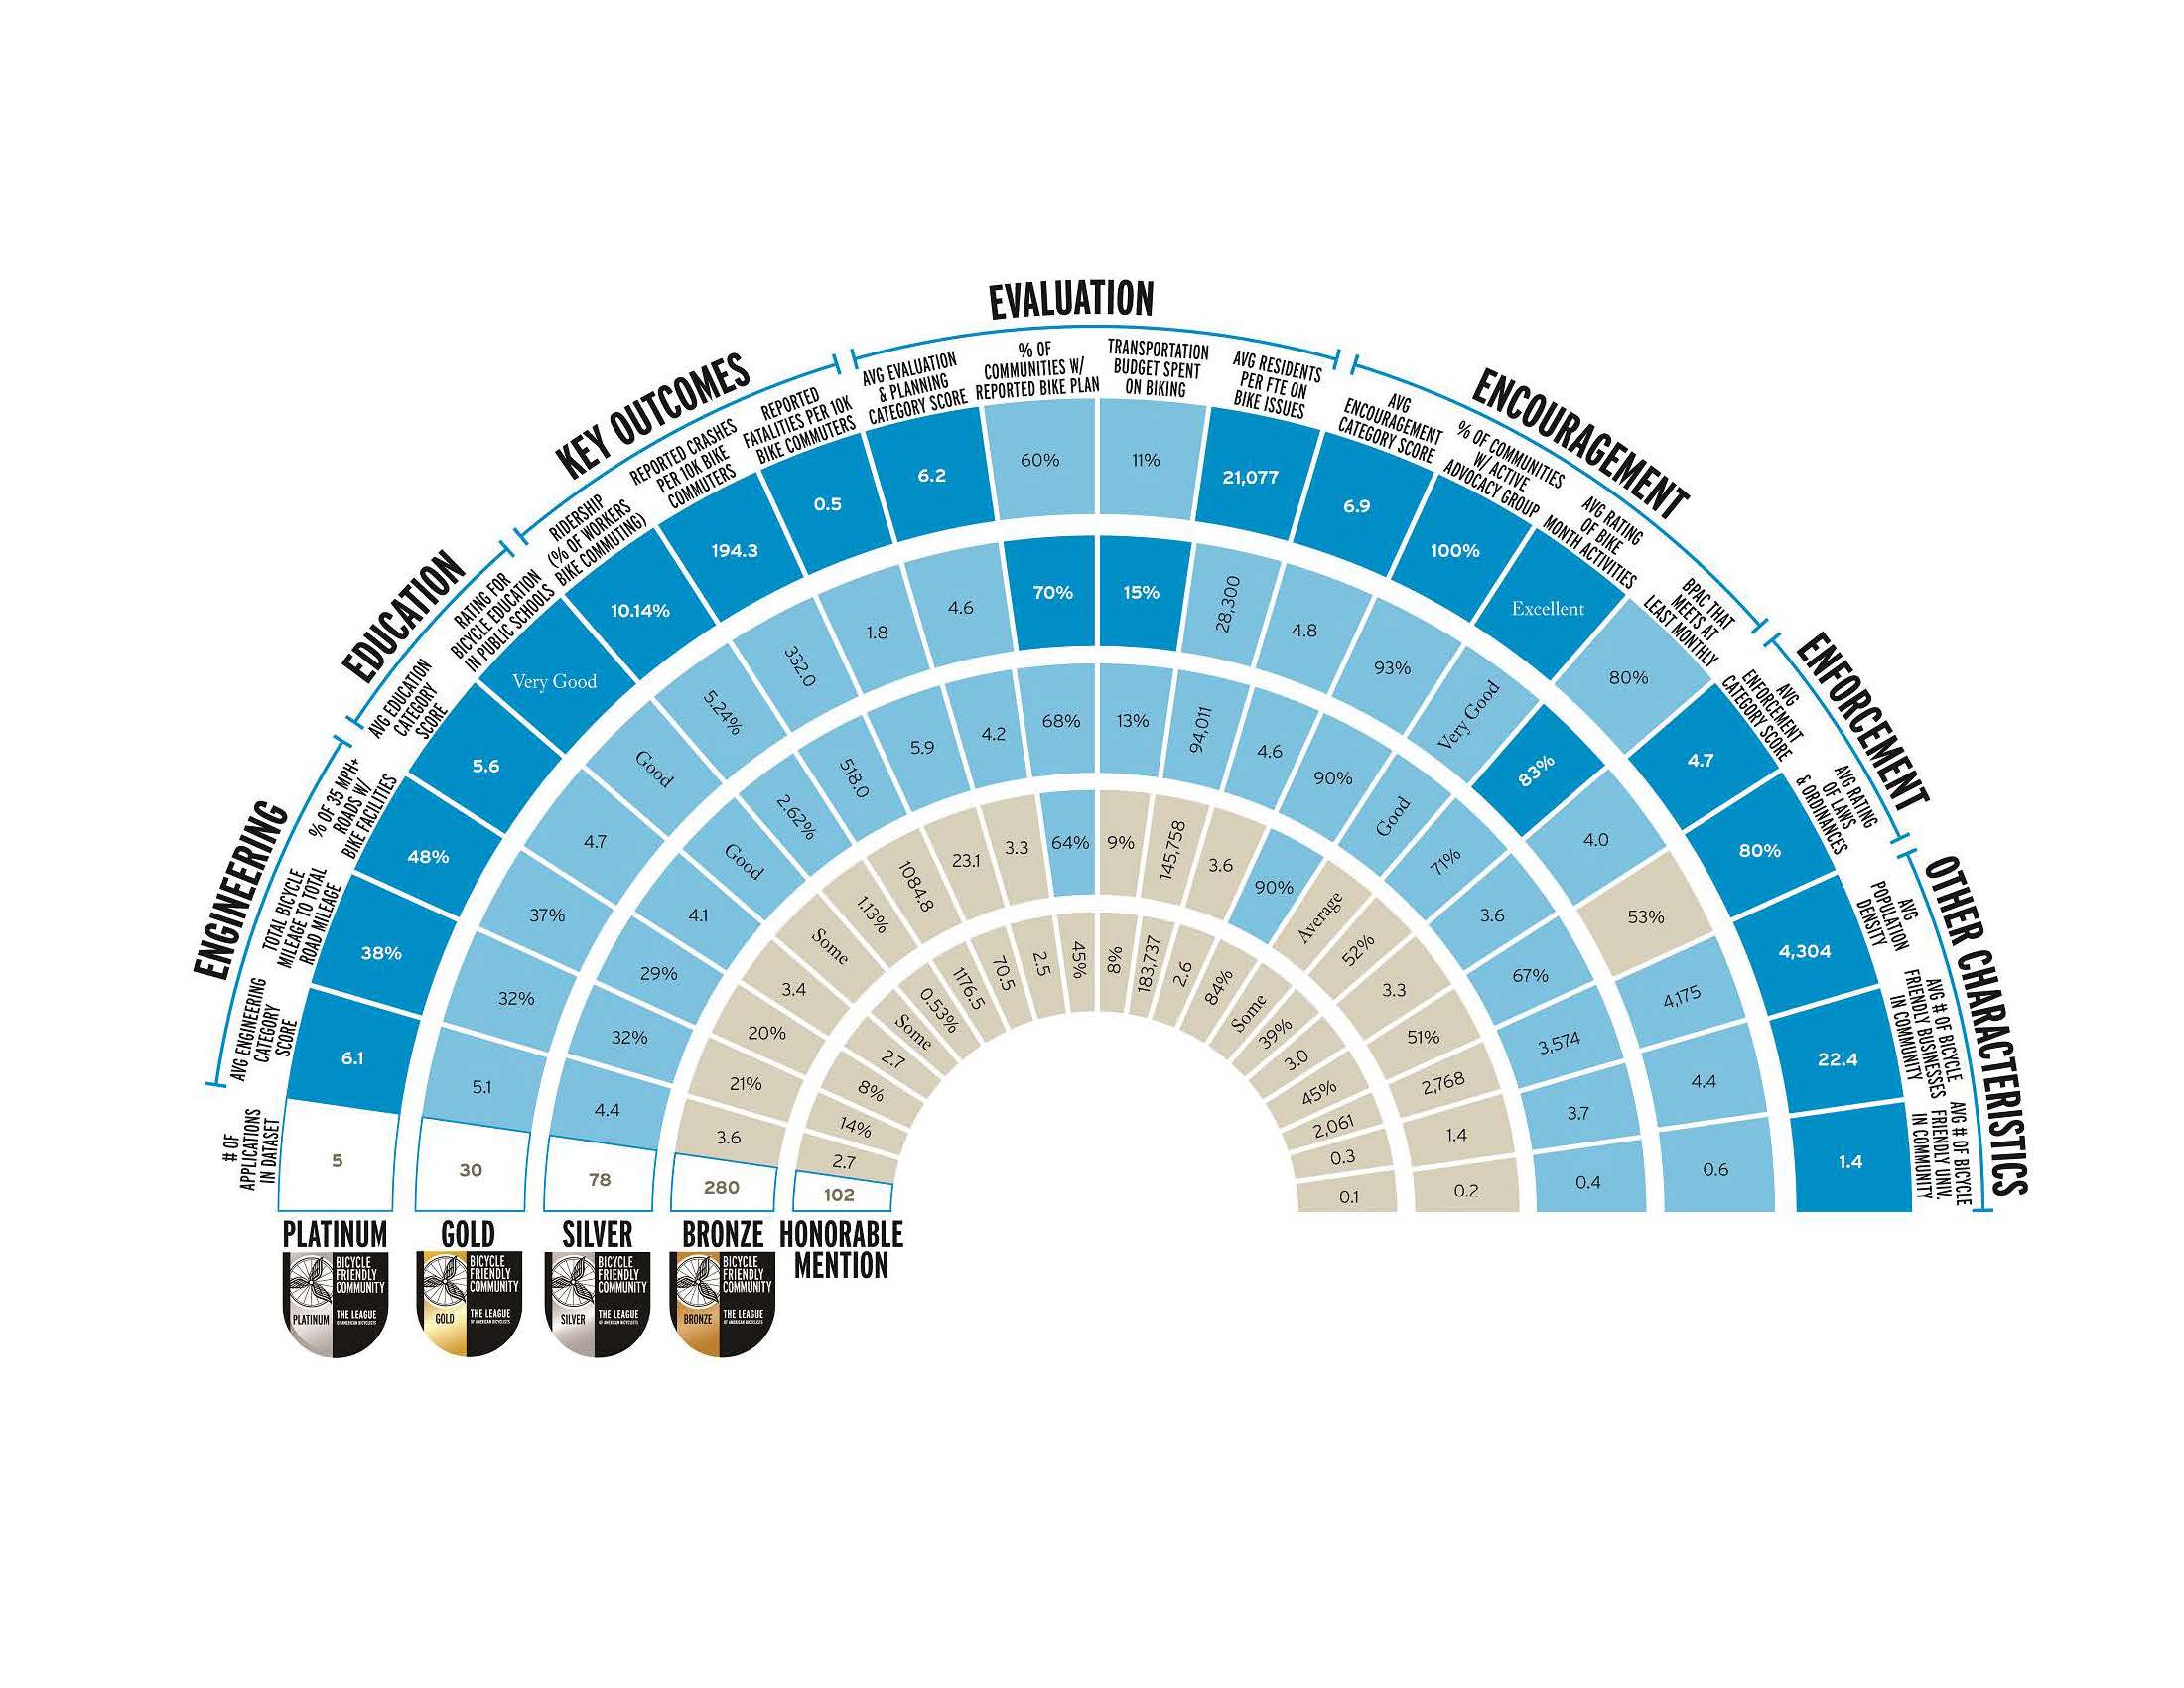
The League of American Bicyclists’ Bicycle Friendly Community (BFC) program provides insight into the range of actions that communities can and do take as they work to get more people riding bicycles and try to improve bicyclist safety and public health. The League’s data show that communities that have received a BFC award have a bicyclist fatality rate that is less the half the fatality rate of communities that apply but do not receive awards. 29 As award levels increase, the prevalence of bicycling, safety of bicycling, and prevalence of bicycle infrastructure all increase. Each of these indicators support connections between BFC efforts and better health outcomes.
The BFC Program, started in 1995, was updated to its current “5 E” framework (engineering, education, encouragement, enforcement, and evaluation/planning) in 2002. Since 2002, the League has collected data on bicycling-related efforts by more than 800 communities. The goal of the BFC Program throughout its 23 years has been to meet communities where they are, recognizing that there is no single route to becoming a Bicycle Friendly Community. Indeed, the League believes that each community can capitalize on its own unique strengths to make bicycling better.

Recently, the Bicycle Alliance of Minnesota (BikeMN) used funding from Blue Cross Blue Shield of Minnesota to provide technical assistance and training throughout the state and enabled more than 20 communities, including small and rural towns, to participate in bicycle promotion efforts structured around the BFC program. This work has built on the national BFC Program, resulting in part in a Resource Guide for Minnesota communities; 30 BikeMN’s capacity-building efforts have been recognized as an approved intervention by the state’s Health Improvement Partnership. 31
Despite the diversity of actions reported by communities that apply to the BFC program, some activities are especially common among awarded communities, including the following:
ADVANCING UNDERSTANDING: HEALTHY TRANSPORTATION
When talking about active transportation and health, a clear connection exists between physical activity and better health outcomes. However, less clear is how the interventions that encourage more people to choose bicycling and walking tie to specific health outcomes. To better communicate the value of changes in transportation behavior to decision makers, researchers has developed health impact models to frame the discussion. Stakeholders can find at least two internationally accepted models for bicycling and walking as health interventions:
The National Association of County and City Health Officials (NACCHO) included both HEAT and ITHIM in its Collection of Health Impact Assessment Predictive Modeling Tools. 37 This collection features 26 modeling tools, including at least three tools that estimate walking and/or bicycling trips or health effects related to projects or changes in active transportation. Based on NACCHO’s data, ITHIM has been used and publicized in places like Sacramento 38 and Nashville. 39 The use of ITHIM has also been highlighted in a guidebook on Building Healthy & Prosperous Communities, produced by Transportation for America and the American Public Health Association. 40
To further understanding of the health impacts of transportation projects, additional evaluation studies are needed. The Centers for Disease Control and Prevention provide potential evaluation methods as part of “Be Active: Connecting Routes+ Destinations,” which encourages communities to “whenever possible, evaluate impact.” 41 This resource also helps communities understand when evaluation is appropriate.

EMBRACING EQUITY: COMMUNITY HEALTH DEPENDS ON INCLUSIVE ACTIONS
Increasingly, healthcare providers and policymakers are defining healthcare to include not just treatment services, but also socioeconomic conditions that affect health outcomes. These efforts are often based on the work done by public health professionals, who focus on systems, policy, and environmental approaches to improve health. Broadly, the conditions that affect health outcomes are referred to as “social determinants of health.” Some examples of how the public health community has embraced and defined social determinants of health as a basis for addressing health and health inequities are provided below:
- The World Health Organization (WHO) defines social determinants of health as “the conditions in which people are born, grow, live, work, and age. These circumstances are shaped by the distribution of money, power, and resources at global, national, and local levels.” 42
- Community health activities often explicitly include activities to address social determinants of health and health disparities through community-level, rather than individually focused, actions. A 2013 report by Health Resources in Action notes that the community health movement focused on “empowerment and community-driven change rather than on pre-determined activities, on process rather than outcomes, on policy change and environmental strategies rather than on individual interventions, and on social determinants of health rather than on the treatment of disease.” 43 This focus on community-driven change can be contrasted with transportation safety messaging that often focuses on individual actions. 44
- The Department of Health and Human Services’ “Healthy People 2020 initiative organizes the social determinants of health around five key domains: (1) Economic Stability, (2) Education, (3) Health and Health Care, (4) Neighborhood and Built Environment, and (5) Social and Community Context.” 45
- American Public Health Association, Public Health Institute, and the California Department of Health created Health in All Policies: A Guide for State and Local Governments 46 as a guide for groups outside of public health to engage with the environmental justice and health equity concepts that have been pursued by public health agencies. This guide calls for increased collaboration since “[r]esponsibility for the social determinants of health falls to many nontraditional health partners such as housing, transportation, education, air quality, parks, criminal justice, energy, and employment agencies.” 47
Agency staff and partners in the transportation sector also are responsible for addressing social determinants of health and the ways that transportation plays a role in the impact of those determinants. At the federal level, “[t]he Executive Order on Environmental Justice (EJ) directs federal agencies to identify and address disproportionately high and adverse environmental and health impacts on low-income populations and racial and ethnic communities.” 48 Among transportation partners, the Untokening’s principles state, “Communities have the right to demand and expect healthy environments and EQUAL ACCESS to the benefits of green space—and remediation of past environmental harms.” 49 The Untokening is “a multiracial collective that centers the lived experiences of marginalized communities to address mobility justice and equity.” 50
Whether people can safely bike, walk, or use transit and whether they can access jobs or healthcare without access to a car, are important elements of the conditions in which people are born, grow, live, work, and age. While bicycling and walking are often thought of in terms of transportation, and most bike/walk organizations primarily work with transportation agencies, 51 both agencies and organizations may benefit from a shift like the one that has occurred in the health sector through the incorporation of the social determinants of health. Transportation agencies can benefit from thinking beyond travel speeds or congestion metrics, just as healthcare agencies can benefit from thinking about societal factors that influence health outcomes.

BFA – Bike Pins, courtesy of the League of American
Centers for Disease Control and Prevention. Public Health Matters Blog (September 18, 2015). A Healthy Community is a Prepared Community. Avail- able at https://blogs.cdc.gov/publichealthmatters/2015/09/a-healthy-community-is-a-prepared-community.
Centers for Disease Control and Prevention, National Center for Chronic Disease Prevention and Health Promotion. Community Chronic Disease: A Significant Public Health Threat (November 21, 2017). Available at https://www.cdc.gov/nccdphp/dch/about/index.htm.
Health Resources in Action. Defining Healthy Communities (July 25, 2013) at p. 6. Available at https://hria.org/wp-content/uploads/2016/10/defining- healthycommunities.original.pdf.
U.S. Department of Health and Human Services. Step It Up! The Surgeon General’s Call to Action to Promote Walking and Walkable Communities (2015) at p. 1. Available at https://www.surgeongeneral.gov/library/calls/walking-and-walkable-communities/call-to-action-walking-and-walkable-communities.pdf.
Bureau of Labor Statistics. Sports and exercise among Americans (August 4, 2016). Available at https://www.bls.gov/opub/ted/2016/sports-and-exer- cise-among-americans.htm.
Angie Schmitt. Streetsblog USA. Survey: 100 Million Americans Bike Each Year, but Few Make It a Habit (March 4, 2015). Available at https://usa. streetsblog.org/2015/03/04/survey-100-million-americans-bike-each-year-but-few-make-it-a-habit.
Madeline Weikert, Deirdre Dlugonski, Swathi Balantrapu, and Robert Motl. International Journal of MS Care (Spring 2011). Most Common Types of Physical Activity Self-Selected by People with Multiple Sclerosis. Available at https://www.ncbi.nlm.nih.gov/pmc/articles/PMC3882947/.
Lilah Besser and Andrew American Journal of Preventive Medicine (2005). Walking to Public Transit: Steps to Help Meet Physical Activi- ty Recommendations. Available at https://www.cdc.gov/healthyplaces/articles/besser_dannenberg.pdf.
U.S. Department of Health and Human Services. Physical Activity Guidelines Advisory Committee Report, 2008. Available at https://health.gov/paguidelines/report/pdf/CommitteeReport.pdf. Frank W. Booth, Christian K. Roberts, and Matthew J. Laye. National Center for Biotechnology Information. U.S. National Library of Medicine. Lack of Exercise Is a Major Cause of Chronic Disease. Available at https://www.ncbi.nlm.nih.gov/pmc/articles/PMC4241367/#R412.
U.S. Department of Health and Human Services. 2008 Physical Activity Guidelines for Americans Summary. Available at https://health.gov/paguidelines/guidelines/summary.aspx. See also U.S. Department of Health and Human Services. Physical Activity Guidelines for Americans 2nd edition (2018) Available at https://health.gov/paguidelines/second-edition/pdf/Physical_Activity_Guidelines_2nd_edition.pdf.
U.S. Department of Health and Human Services. 2018 Physical Activity Guidelines Advisory Committee Scientific Report-Figure F6-2 at p. F6-8. Available at https://health.gov/paguidelines/second-edition/report/pdf/12_F-6_All-cause_Mortality_Cardiovascular_Mortality_and_Incident_Cardiovascu- lar_Disease.pdf.
Centers for Disease Control and Prevention. National Center for Chronic Disease Prevention and Health Promotion. Division of Nutrition, Physical Activity and Obesity. Physical Activity, Physical Activity Basics. How Much Physical Activity Do You Need? (November 12, 2018). Available at https:// cdc.gov/cancer/dcpc/prevention/policies_practices/physical_activity/guidelines.htm.
J. Larry Durstine, Benjamin Gordon, Zhengzhen Wang, and Xijuan Luo. Journal of Sport and Health Science (2013). Chronic disease and the link to physical activity. Available at https://www.sciencedirect.com/science/article/pii/S2095254612000701.
Martin , Panter J., Suhrcke M., Oglivie D. Journal of Epidemiology and Community Health. Impact of changes in mode of travel to work on changes in body mass index: evidence from the British Household Panel Survey. Available at https://www.ncbi.nlm.nih.gov/pubmed/25954024 (“After adjustment for socioeconomic and health-related covariates, the first analysis (n=3269) showed that switching from private motor transport to active travel or public transport (n=179) was associated with a significant reduction in BMI compared with continued private motor vehicle use (n=3090; -0.32 kg/m(2), 95% CI -0.60 to -0.05). … The second analysis (n=787) showed that switching from active travel or public transport to private motor transport was associated with a significant increase in BMI (0.34 kg/m(2), 0.05 to 0.64)”).
Mytton OT, Panter J, Preventive Medicine (2016). Longitudinal associations of active commuting with body mass index. Available at https://www.ncbi.nlm.nih.gov/pubmed/27311338.
Centers for Disease Control and Prevention. High Blood Pressure. Available at https://www.cdc.gov/bloodpressure/index.htm.
American Heart Association. Health Threats from High Blood Pressure. Available at http://www.heart.org/HEARTORG/Conditions/HighBloodPressure/LearnHowHBPHarmsYourHealth/Health-Threats-From-High-Blood-Pressure_UCM_002051_Article.jsp#.WpB65oPwYdU.
Keith Diaz and Daichi Shimbo. Current Hypertension Reports (2013). Physical Activity and the Prevention of Hypertension. Available at https://ncbi.nlm.nih.gov/pmc/articles/PMC3901083/ (“Recent epidemiologic evidence has demonstrated a consistent, temporal, and dose-dependent relationship between physical activity and the development of hypertension. Experimental evidence from interventional studies have further confirmed a relationship between physical activity and hypertension as the favorable effects of exercise on blood pressure reduction have been well characterized in recent years.”)
Colberg et. al American Diabetes Association. Physical Activity/Exercise and Diabetes: A Position Statement of the American Diabetes Association. Available at http://care.diabetesjournals.org/content/39/11/2065.
Colberg et. al. American Diabetes Association. Physical Activity/Exercise and Diabetes: A Position Statement of the American Diabetes Association. Available at http://care.diabetesjournals.org/content/39/11/2065.
Dr. Sheri Colberg. Diabetes Self-Management. Increasing Insulin Sensitivity (September 10, 2015). Available at https://www.diabetesselfmanagement. com/managing-diabetes/treatment-approaches/increasing-insulin-sensitivity/.
American Academy of Allergy, Asthma & Immunology. Exercise and Asthma. Available at https://aaaai.org/conditions-and-treatments/library/asthma-library/exercise-and-asthma.
Lene Lochte, Kim Nielsen, Poul Petersen, and Thomas Platts-Mills. BioMed Central Pediatrics (2016). Childhood asthma and physical activity: a systematic review with meta-analysis and Graphic Appraisal Tool for Epidemiology assessment. Available at https://ncbi.nlm.nih.gov/pmc/articles/ PMC4836150/ and Eijkemans M, Mommers M, Draaisma JMT, Thijs C, Prins MH. PLoS ONE (2012). Physical Activity and Asthma: A Systematic Review and Meta-Analysis. Available at https://doi.org/10.1371/journal.pone.0050775.
American Public Health Association. Improving Health Through Transportation and Land-Use Policies (2009). Available at https://apha.org/policies-and-advocacy/public-health-policy-statements/policy-database/2014/07/31/08/21/improving-health-through-transportation-and-land-use-policies.
Brian McKenzie. U.S. Census Bureau. Modes Less Traveled – Bicycling and Walking to Work in the United States: 2008-2012 (2014). Available at https://www.census.gov/prod/2014pubs/acs-25.pdf.
Hitesh Bhasin. Marketing Individual marketing and its impact in today’s business environment (December 25, 2017). Available at https://www.marketing91.com/individual-marketing/.
Derek Hofbauer, Dana Dickman, and Jessica Roberts. Alta Planning + Design. Integrated Transport and Health Impact Modeling Tool (May 2, 2016). Available at https://blog.altaplanning.com/integrated-transport-and-health-impact-modeling-tool-ithim-80a8c48984af.
Derek Hofbauer, Dana Dickman, and Jessica Roberts. Alta Planning + Design. Integrated Transport and Health Impact Modeling Tool (May 2, 2016). Available at https://blog.altaplanning.com/integrated-transport-and-health-impact-modeling-tool-ithim-80a8c48984af (the report refers to both “burden of disease” and “disability adjusted life years” according to the World Health Organization “burden of disease measures burden of disease using the disability-adjusted-life-year (DALY). This time-based measure combines years of life lost due to prema- ture mortality and years of life lost due to time lived in states of less than full ”). World Health Organization. Mortality and global health estimates. Available at http://www.who.int/topics/global_burden_of_disease/en/.
See The Building Blocks of a Bicycle Friendly Community. https://bikeleague.org/content/building-blocks-bicycle-friendly-communities.
Bicycle Alliance of Minnesota. Bicycle Friendly Community Resource Guide. Available at http://www.bikemn.org/collaboration/bicycle-friendly-community-resource-guide.
Minnesota Department of Health. Active Living in Communities Implementation Guide (July 2018). Available at http://www.health.state.mn.us/healthreform/ship/docs/ship4/ActiveLiving.pdf.
World Health Organization. Health economic assessment tool (HEAT) for cycling and walking. Available at http://www.euro.who.int/en/health-topics/environment-and-health/Transport-and-health/activities/guidance-and-tools/health-economic-assessment-tool-heat-for-cycling-and-walking.
World Health Organization. Health economic assessment tool (HEAT) for cycling and walking. Available at http://www.euro.who.int/en/health-topics/environment-and-health/Transport-and-health/activities/guidance-and-tools/health-economic-assessment-tool-heat-for-cycling-and-walking.
World Health Organization. Health economic assessment tool (HEAT) for cycling and walking. Available at http://www.euro.who.int/en/health-topics/environment-and-health/Transport-and-health/activities/guidance-and-tools/health-economic-assessment-tool-heat-for-cycling-and-walking.
Centre for Diet and Activity Research. Integrated Transport and Health Impact Modelling Tool (ITHIM). Available at http://www.cedar.iph.cam.uk/research/modelling/ithim/.
Centre for Diet and Activity Research. Integrated Transport and Health Impact Modelling Tool (ITHIM). Available at http://www.cedar.iph.cam.uk/research/modelling/ithim/.
National Association of County and City Health Officials (NACCHO). Health Impact Assessment. Available at https://naccho.org/programs/ community-health/healthy-community-design/health-impact-assessment.
Alex Karner, Dana Rowangould, Yizheng Wu, Ofurhe Igbinedion, and Jonathan London. National Center for Sustainable Transportation at the University of California Development and Application of an Integrated Health Impacts Assessment Tool for the Sacramento Region (October 2017). Available at https://ncst.ucdavis.edu/wp-content/uploads/2016/10/NCST-TO-033.3-London_ITHIM_Final-Report_OCT-2017.pdf.
Whitfield, Meehan, Maizlish, and Wendel. Journal of Transportation & Health (2017). The Integrated Transport and Health Impact Modeling Tool in Nashville, Tennessee, USA: Implementation Steps and Lessons Learned. Available at https://ncbi.nlm.nih.gov/pubmed/27595067.
Transportation for America. Healthy Metro Areas Guidebook. Available at http://t4america.org/maps-tools/healthy-mpos-guidebook/.
Centers for Disease Control and Prevention. The Community Preventive Services Task Force’s Built Environment Recommendation to Increase Physical Activity Implementation Resource Guide. Available at https://cdc.gov/physicalactivity/community-strategies/beactive/implementation-resource-guide.html.
See Sanne Magnan, National Academy of Medicine. Social Determinants of Health 101 for Health Care: Five Plus Five (October 9, 2017). Available at https://nam.edu/social-determinants-of-health-101-for-health-care-five-plus-five/ (quote from World Health About social determinants of health. Available at http://www.who.int/social_determinants/sdh_definition/en/).
Health Resources in Action. Defining Healthy Communities (July 25, 2013). Available at https://hria.org/wp-content/uploads/2016/10/defining-healthycommunities.original.pdf.
A commonly cited statistic in transportation safety is that more than 90% of crashes are due to human error, implying each human error is an individual error rather than a product of a system that is subject to error. See e.g. Bryant Walker Smith. The Center for Internet and Society. Human Error as a Cause of Vehicle Crashes (December 18, 2013). Available at http://cyberlaw.stanford.edu/blog/2013/12/human-error-cause-vehicle-crashes.
Office of Disease Prevention and Health Promotion. U.S. Department of Health and Human Social Determinants of Health. Available at https://www.healthypeople.gov/2020/topics-objectives/topic/social-determinants-health/interventions-resources.
American Public Health Association. Health in All Policies. Available at https://apha.org/topics-and-issues/health-in-all-policies.
American Public Health Association. An Introduction to Health in All Policies: A Guide for State and Local Governments. Available at https://apha.org/-/media/files/pdf/factsheets/hiapguide_4pager_final.ashx?la=en&hash=A6776B82FCA90B3346A6B5851697ADEB2448D4E4.
U.S. Department of Transportation. Every Place Counts Leadership Academy Transportation Toolkit at p. 19. Available at https://www.transportation. gov/sites/dot.gov/files/docs/ToolkitFinal2017.pdf.
The Untokening. Untokening 1.0 Principles of Mobility Justice at p. Available at https://static1.squarespace.com/static/579398799f7456b10f43af- b0/t/5a08797553450af07cb310dd/1510504821822/Untokening+1.0+web.pdf.
The Untokening. Available at http://www.untokening.org/.
See “Chart III-49: Institutional partners of League of American Bicyclists’ member groups” in Section IX: Engaged Public