IN THIS SECTION, THE BENCHMARKING REPORT LOOKS AT THE INTERACTIONS BETWEEN BICYCLING AND WALKING, ECONOMIC DEVELOPMENT, AND INCENTIVES FOR BIKING AND WALKING TO WORK
THIS DISCUSSION INCLUDES HOW ECONOMIC DEVELOPMENT CAN LEAD TO GENTRIFICATION AND THE DISPLACEMENT OF CURRENT RESIDENTS.
Use this section to become more informed about how bicycling and walking are promoted as a part of economic development strategies and within companies as part of employee retention and wellness.
Making the Case: Bicycling & Walking as Economic Development Strategies
- Cases of Bicycling- & Walking-oriented Economic Development
- The Case for Business Investments in Active Transportation
Advancing Understanding: Is Motor Vehicle Travel Essential to Commerce?
Embracing Equity: Development & Displacement
Making the Health Connection: Capturing Health-economic Benefits of Transportation Projects
BICYCLING & WALKING AS ECONOMIC DEVELOPMENT STRATEGIES
Cases of Bicycling- & Walking-oriented Economic Development
Placemaking and quality of life initiatives that attract and retain employers and employees are increasingly common economic development strategies. 1 Bicycling and walking are important components of these initiatives. Numerous studies support the argument that biking and walking improvements lead to increased retail sales and property values. A 2013 report by Clifton and colleagues combined a literature review with new data collection and found built environment elements that support bicycling (e.g., bike corrals and parking) were significantly associated with increased bike mode share among patrons of local businesses. 2 Other evidence suggests built environment changes can improve retail sales for nearby businesses. One case study from Fort Worth, Texas, found an over 100% increase in retail sales after bike lanes and improved bike parking were added to a local commercial street. 3
Recent research suggests that property values are higher and more stable where people can easily bike and walk. A recent study of the 30 largest metro areas in the U.S. found that office rental premiums in walkable urban places (“WalkUPs”) were higher than drivable suburban places ($35.33 per square foot compared to $20.32 per square foot). Excluding New York City metro as an outlier, WalkUPs still achieved a 44% price premium over drivable suburban places in the other metro areas studied. 4 A study of Sacramento region neighborhoods found that walkable neighborhoods experienced less of a decline in home values compared to suburban auto-dependent neighborhoods between 2005 and 2012. 5 In Indianapolis, the Indiana University Public Policy Institute estimated that the $62.5 million, 8-mile-long Indianapolis Cultural Trail has resulted in more than a $1 billion increase in property values for properties within 500 feet of the trail. 6
Bicycle tourism can also be a significant economic development strategy for communities, including rural communities:
- A 2012 OREGON BICYCLE TOURISM STUDY found that bicycle-related expenditures amounted to nearly $400 million and supported 4,600 jobs within Oregon. 7
- The annual economic impact of recreational bicycling and bicycle tourism is estimated at $924 million for the state of WISCONSIN. 8
- For NORTH CAROLINA’S OUTER BANKS, the annual economic impact of bicycle tourists is estimated at $60 million. In addition, 1,400 jobs are created or sustained annually because of these tourists. 9
- Every trail visitor to the VIRGINIA CREEPER TRAIL generated between $24 and $38 per visit. Trail visitors contributed an estimated $1.2 million annually to the local economy. 10
- The Institute for Tourism and Recreation Research (ITRR) at the UNIVERSITY OF MONTANA conducts nonresident surveys year-round throughout the state of Montana. Data from ITRR surveys indicate that an average of 500,000 nonresidents participate in road touring/bicycling in Montana each year and that they spend an average of $75.75 per day, creating approximately $38 million in economic activity. 11
The Case for Business Investments in Active Transportation
Businesses that invest in biking, walking, and other efforts that allow employees to use active transportation hope to capture at least some of the following benefits of increased physical activity:
- Improved employee health–including reduced cardiovascular risks, especially among women 12
- Lower rates of absence–equivalent to one less sick day per year 13
- Improved employee productivity, including more-productive organizational behavior and positive employee well-being 14
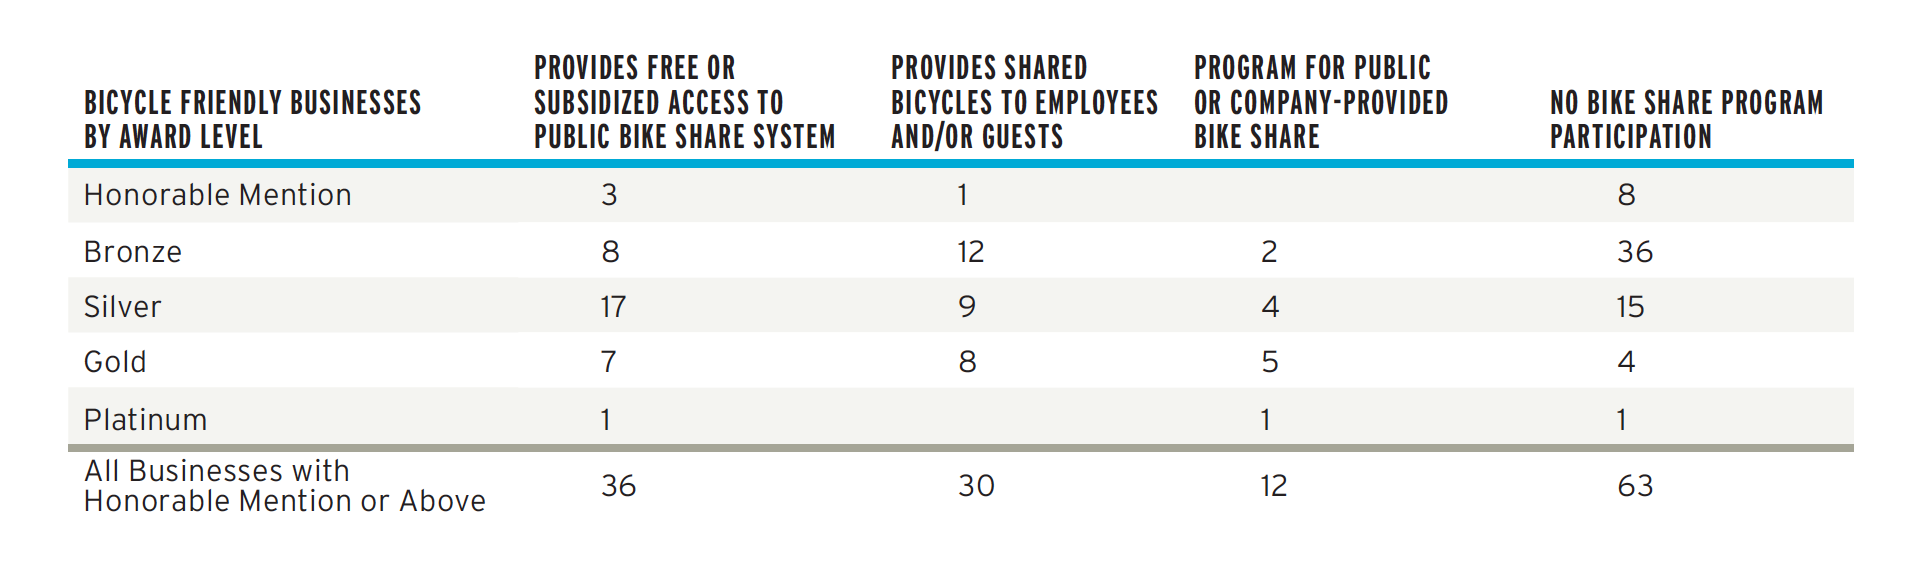
Businesses have found it advantageous to invest in biking, walking, and other efforts to shift workers to active transportation. Since its creation in 2008, more than 1,800 businesses have taken part in the Bicycle Friendly Business program of the League of American Bicyclists. In recent years, many of these businesses have invested in bike share programs for their employees. Of the 143 businesses that have applied since 2015, 55% (79) provide shared bicycles directly to employees and/or guests or provide subsidized access to a public bike share program.
Footnote 15
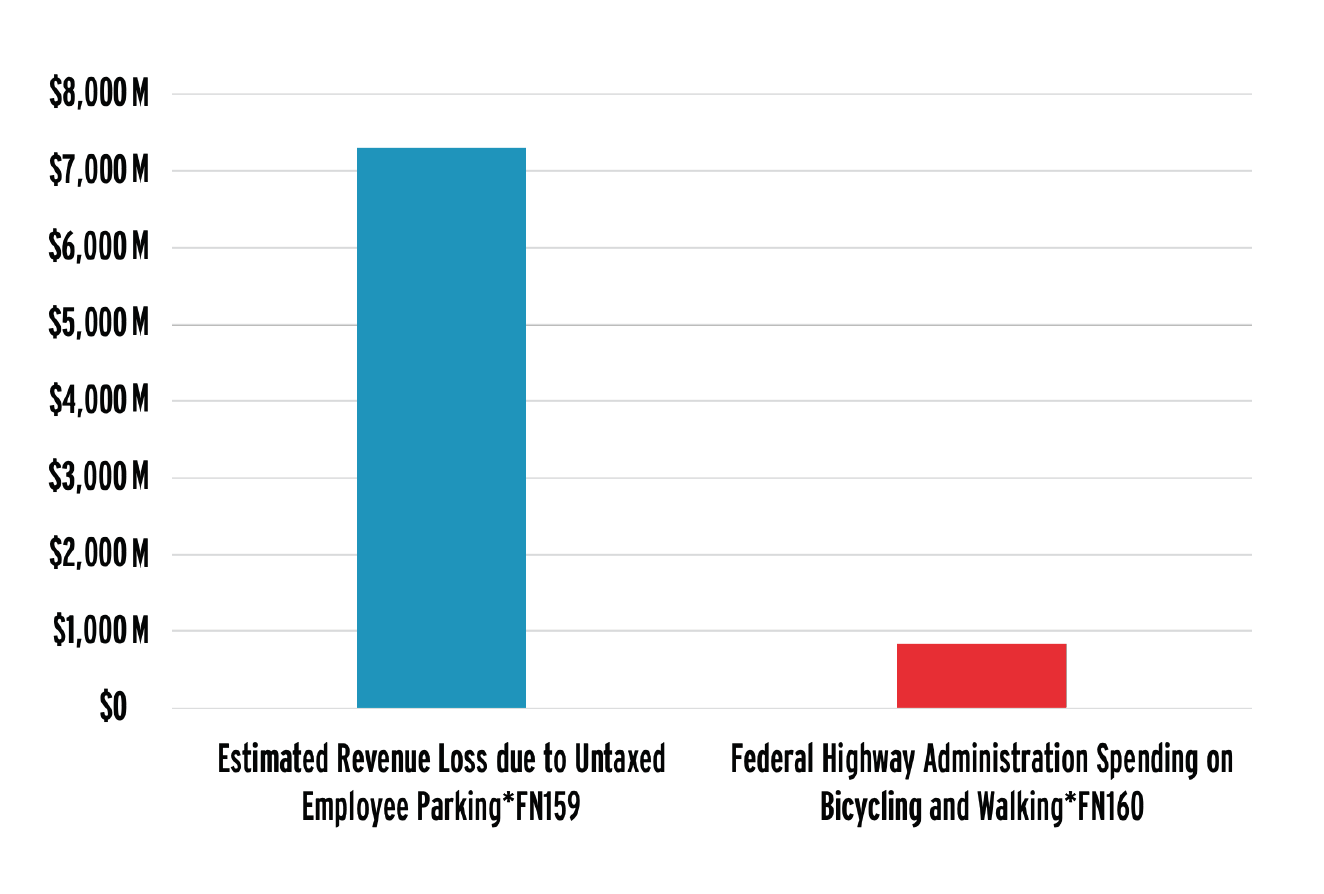
Businesses that support incentives for biking, walking, and other active transportation modes face public policies that prioritize driving. Perhaps the most obvious example is the system of commuter tax benefits in the United States. Qualified transportation fringe benefits allow employers to provide parking, transit, or vanpool payments or accommodations without that value counting as income for either the employer’s payroll taxes or the employee’s income taxes. 16 Every year the Internal Revenue Service (IRS) forgoes approximately $7.3 billion in tax revenue due to the commuter parking tax benefit, which allows business to provide tax-free parking and to exempt payments for parking from income and payroll taxes. 17 By comparison, the federal government on average spent an average of just over 11% of this figure, or $832 million per year, on biking and walking infrastructure between 2013 and 2017. 18
Until recently, parking tax benefits were available for twice the value of transit benefits. Data from the IRS show that these commuter benefits are primarily offered and used by higher income workers at large employers, with workers in the highest 25% of income offered commuter benefits at more than 6 times the rate of workers in the lowest 25% of income, despite lower-income workers paying a greater portion of their income for transportation. 21
In 2009, the U.S. Congress decided to provide a tool for businesses to promote active transportation by creating the bicycle commuter tax benefit. This benefit allowed employers to provide up to $20 per month to people who bicycled to work for qualified bike-related expenses without that reimbursement being subject to income and payroll taxation. 22 Many employers chose to offer this benefit as part of providing “commuter benefits as a recruitment and retention tool to broaden the range of commute options available to employees and to incentivize sustainable behavior and green practices.” 23
In 2017, the U.S. Congress partially suspended the bicycle commuter tax benefit as part of the Tax Cut and Jobs Act. This was part of a larger change in commuter benefits, which eliminated the ability of employers to deduct the cost of providing commuter benefits. The suspension of the bicycle commuter benefit preserved the ability of employers to deduct their costs related to providing the benefit while making any reimbursements taxable income to employees. 24 The Joint Committee on Taxation estimated the suspension of the employee portion of the bicycle commuter benefit as a change with an impact of less than $5 million per year. 25
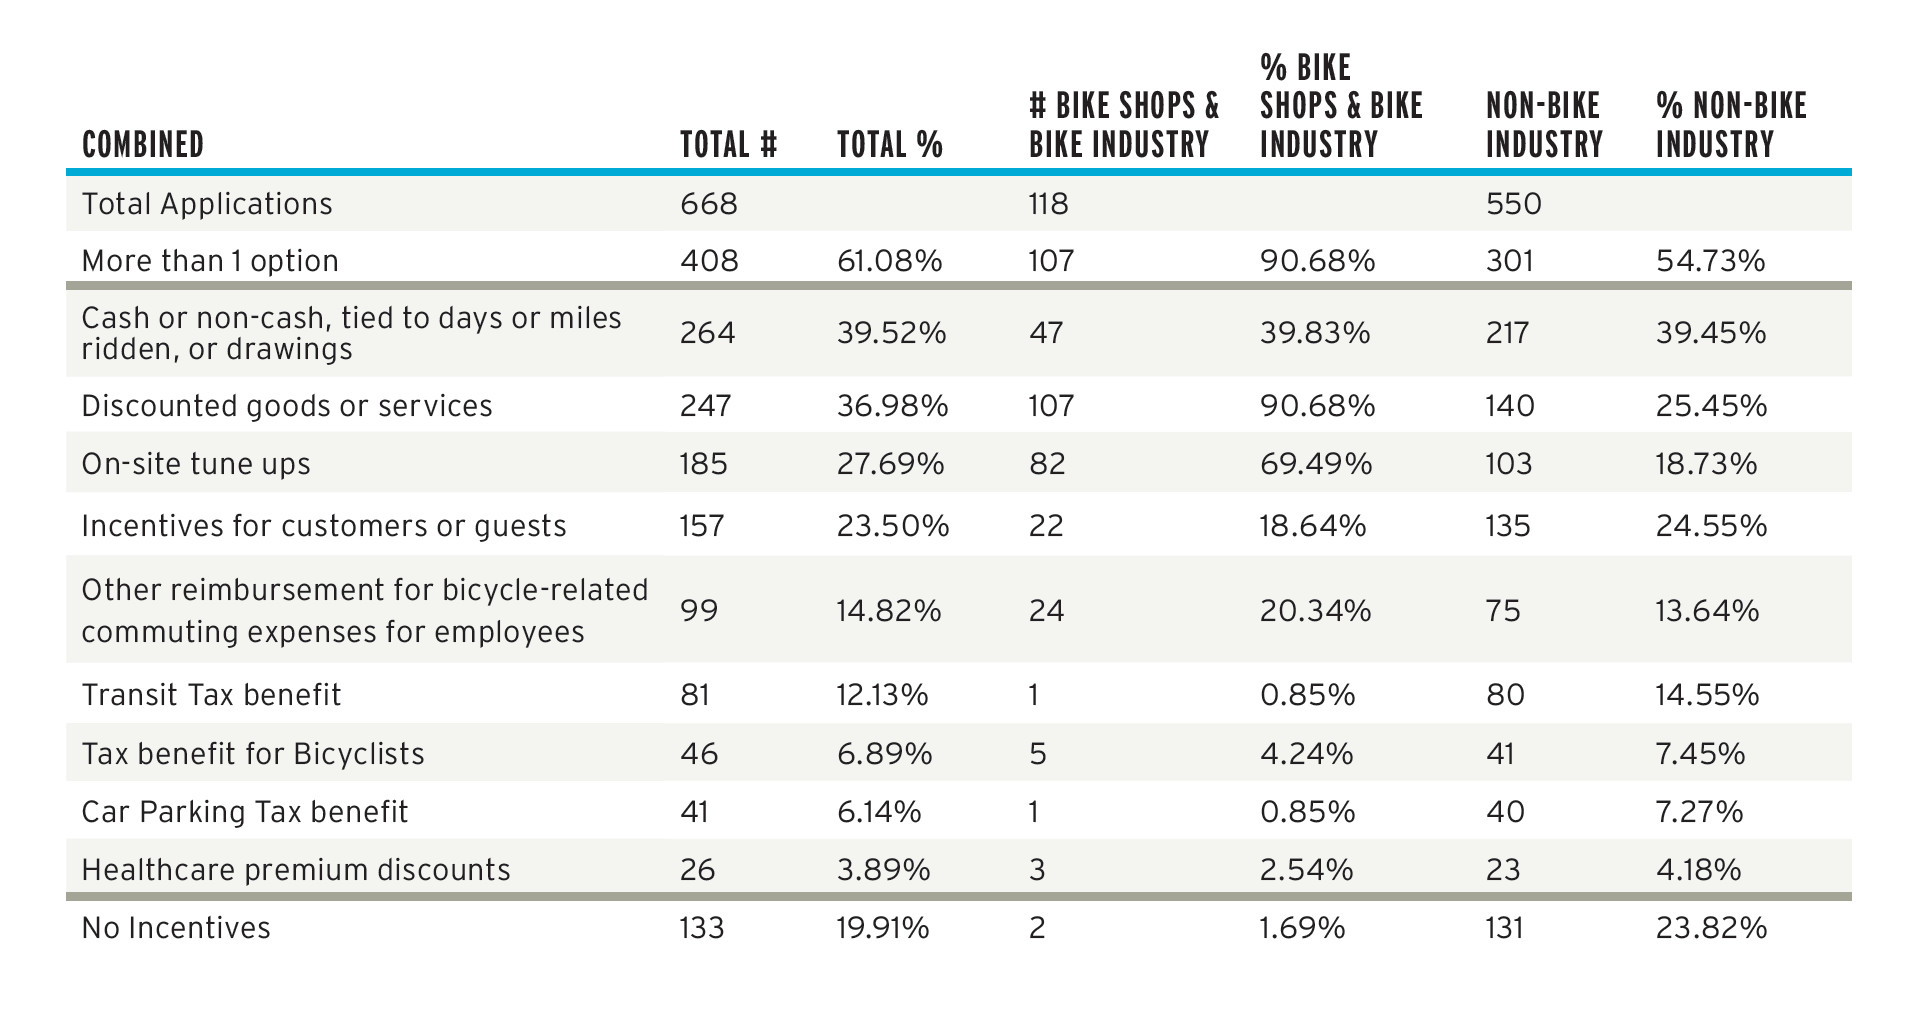
Despite the partial suspension of the bicycle commuter tax benefit, many employers likely will still look for ways to incentivize bike commuting because many were already offering non-tax preferred bicycling benefits. As an example, data from the League of American Bicyclists’ Bicycle Friendly Business Program show that 80% of the 668 businesses that applied between 2009 and 2017 offered at least one incentive for bike commuting. 26 While slightly less than 7% of those businesses reported offering the bicycle commuter tax benefit, nearly 40% reported offering cash incentives or other taxable bicycling- related incentives based on bicycle use. Due to the types of businesses that have applied to the program, the table below separates bike shop and bike industry businesses from other businesses.
Footnote 27
A recent report from the European Cycling Federation shows that nine of 11 examined European countries have public policies that provide fiscal incentives for cycling to work, ranging from reimbursements for bike share subscriptions to tax exemptions that cover the purchase of a new bicycle worth up to nearly $1,000 in U.S. dollars. 28
ADVANCING UNDERSTANDING: IS MOTOR VEHICLE TRAVEL ESSENTIAL TO COMMERCE?
According to the Federal Highway Administration, “The long-term trend has been for vehicle travel, as measured in total [vehicle miles traveled], to increase at similar rates as economic growth, as measured in gross domestic product (GDP). 29 “From time to time, this correlation may be discussed as an unchangeable fact, so that attempts to decrease VMT are seen as attempts to reduce economic growth or vibrancy. Of three studies of the relationship reviewed by the FHWA, one found that VMT caused changes in GDP–lending support to the premise that travel, and motor vehicle travel in particular, is essential to commerce and economic growth.” 30
Some research has focused on the positive public policy goals associated with reducing VMT such as fewer traffic fatalities and reduced emissions, and decoupling VMT and economic growth. One 2011 study found, “For the 98 urban areas included in this study, no significant causal relationship was found between VMT and economic activity in either direction.” 31 The study authors went on to state, “These findings suggest that policies designed to reduce VMT may be used without the threat of compromising national economic activity.” 32
| FINDINGS SUGGEST that policies designed to reduce VMT may be used without the threat of compromising national economic activity. |
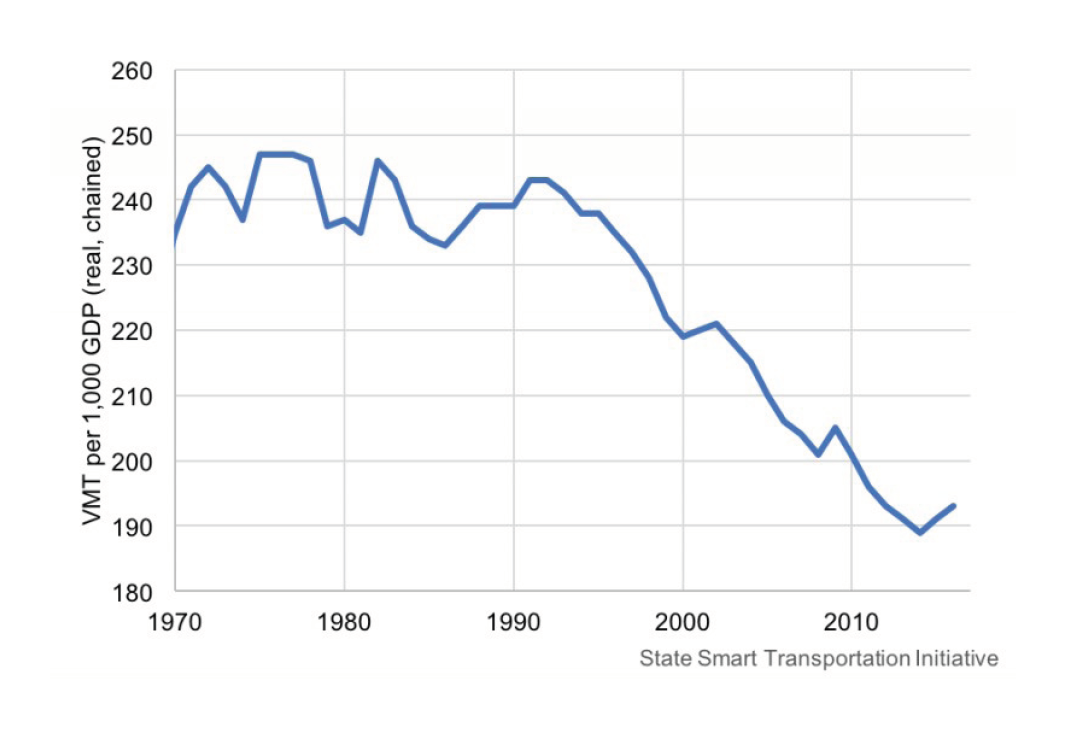
Others have observed that the link between VMT and economic activity has weakened over time. Chris McCahill of the State Smart Transportation Initiative, an initiative of 18 states to “advance environmental sustainability and equitable economic development,” examined total VMT, VMT per capita, and VMT per $1,000 in gross domestic product. McCahill found that the relationship between VMT and economic activity “has weakened considerably over the past roughly 20 years. The number of miles driven per $1,000 of GDP dropped from 240 in 1995 (where it had hovered since before 1970) to 190 in 2016.” 33
Footnote 34
The FHWA’s 2012 report on “decoupling” economic growth and VMT growth suggested that more research is needed to understand the relationship between VMT and economic activity, VMT reduction policies over time, and how to weigh concerns such as sustainability against measures like GDP or VMT. 35 While this research would be helpful at the national level, some places have adopted policies to reduce VMT and are producing positive results. As an example, Seattle and the state of Washington adopted policies to reduce VMT and made investments in transportation demand management, biking, walking, and transit to achieve those policies. These policy and investment choices have helped “decouple” driving and economic activity, with a 23% increase in jobs leading to only a 3% increase in single-occupancy vehicles. 36
EMBRACING EQUITY: DEVELOPMENT & DISPLACEMENT
Discussing positive property values associated with biking and walking improvements or the economic benefits of trails, placemaking, and other biking and walking improvements is incomplete without addressing whether everyone has access to those improvements or can share in the gains associated with them.
According to a report by the Robert Wood Johnson Foundation, residents of low-income communities “are less likely to encounter sidewalks, street/sidewalk lighting, marked crosswalks and traffic calming measures.” 37 Unfortunately, a 2014 study found that bicycle infrastructure investments in Chicago and Portland, OR were “bias[ed] towards increased cycling infrastructure investment in areas of existing or increasing privilege.” 38 This finding lends support to the idea that bicycling and walking investments may perpetuate different provisions of facilities for people of different incomes absent complementary policies to discourage displacement. Policies to discourage displacement include inclusionary zoning, which requires affordable units in new developments; owner occupancy requirements, which reduce absentee landlords and speculation by requiring owner occupancy; and mixed-housing types and sizes, which allow different price points to co-exist. 39
MAKING THE HEALTH CONNECTION: CAPTURING HEALTH-ECONOMIC BENEFITS OF TRANSPORTATION PROJECTS
When transportation investments lead to increased property values or retail sales, these increases can be captured through property or sales taxes. This is often referred to as “value capture” and can be seen directly when a financing mechanism such as tax increment financing—where property taxes are increased according to the incremental property value gains of a defined area 40 —is used. Unfortunately, no well-developed mechanism exists to capture the value of better health outcomes due to active transportation.
At a business level, several opportunities can be identified for value capture, including through reduced health insurance costs. For example, Quality Bicycle Products (QBP), a League of American Bicyclists’ Platinum- awarded Bicycle Friendly Business, realized a 4.4% reduction in employee healthcare costs (an estimated $170,000) over three years by implementing bike-to-work incentives such as additional contributions to employee Health Savings Accounts and giving credits towards QBP products. 41
At the community level, the Integrated Transport and Health Impact Modelling Tool (ITHIM) predicts the health benefits of increasing non-motorized transportation and estimates the financial impact of those benefits. Researchers in Nashville, Tennessee, used ITHIM to model three scenarios of increased walking and bicycling and reduced car travel, finding that “[a] cross the range of scenarios, results suggested that 24 to 123 deaths per year could be averted in the region through a 1%-5% reduction in the burden of several chronic diseases. This translated into $10-$63 million in estimated direct and indirect cost savings per year.” 42
A 2016 report by the Colorado Office of Economic Development and International Trade, the Colorado Department of Public Health and the Environment, the Colorado Department of Transportation, and the Colorado Pedals Project found $510 million in health benefits for Coloradans due to biking and $2.7 billion in health benefits due to walking based on the Health Economic Assessment Tool (HEAT) model. 43
These studies of health benefits due to bicycling and walking suggest that there is significant value that could be captured by communities if a mechanism to do so was developed.
Amy Liu and Owen Washburn. A New Generation of Economic Development (February 24, 20150). Available at https://www.brookings.edu/blog/the-avenue/2015/02/24/a-new-generation-of-economic-development.
K. Clifton, C. Muhs, S. Morrissey, T. Morrissey, K. Currans, and C. Ritter. Oregon Transportation Research and Education Consortium, OTREC-RR-12-15. Examining Consumer Behavior and Travel Choices (February 2013). Available at http://ppms.otrec.us/media/project_files/OTREC-RR-12-15%20Final.pdf.
Elly Blue. Excerpt from Bikenomics: How Bicycling Can Save the Economy published by TriplePundit (12/9/2013). How Bike Lanes Increase Small Business Revenue. Available at https://triplepundit.com/2013/12/bike-lanes-increase-small-business-revenue/.
C. B. Leinberger and P. Lynch. Smart Growth America (2014). Foot Traffic Ahead: Ranking Walkable Urbanism in America’s Largest Metros. Available at http://www.smartgrowthamerica.org/documents/foot-traffic-ahead.pdf.
AARP Livable Communities, Act, Transportation and Mobility Walk Toward Economic Stability: Research on Walkability and Home Value in Sacra- mento (2012). Available at https://aarp.org/livable-communities/act/walkable-livable-communities/info-12-2012/walk-toward-economic-stability-research-on-walkability-and-home-values-in-sacramento.html.
Jessica Majors and Sue Burow. Indiana University Public Policy Institute, School of Public and Environmental Assessment of the Impact of the Indianapolis Cultural Trail: A Legacy of Gene and Marilyn Glick (March 2015) at p. 2. Available at https://s3.amazonaws.com/indyculturaltrail.org/ wp-content/uploads/2015/07/15-C02-CulturalTrail-Assessment.pdf.
Travel Oregon. The Economic Significance of Bicycle-Related Travel in Oregon: 2012, Dean Runyan Associates (May 8, 2013). Available at http:// industry.traveloregon.com/research/archive/the-economic-significance-of-bicycle-related-travel-in-oregon-2012-dean-runyan-associates.
M. Grabow, M. Hahn, and M. Whited. American Trails. Nelson Institute for Environmental Studies, Center for Sustainability and the Global Environment, University of Wisconsin-Madison (January 1, 2010). Valuing Bicycling’s Economic and Health Impacts in Wisconsin. Available at https:// www.americantrails.org/resources/valuing-bicyclings-economic-and-health-impacts-in-wisconsin.
North Carolina Department of Transportation. Transportation Research Record Journal of Transportation Research Board (January 2005). The Economic Impact of Investments in Bicycle Facilities Case Study of the Northern Outer Banks. Available at https://researchgate.net/ publication/245561852_Economic_Impact_of_Investments_in_Bicycle_Facilities_Case_Study_of_North_Carolina’s_Northern_Outer_Banks.
M. Bowker, John C. Bergstrom, and Joshua K. Gill. USDA, U.S. Forest Service, Southern Research Station, and the University of Georgia (December 2004). The Virginia Creeper Trail: An Assessment of User Demographics, Preferences, and Economics. Available at https://www.srs.fs.usda.gov/ recreation/VCT.pdf.
N. Nickerson, J. Jorgenson, M. Berry, J. Kwenye, D. Kozel, and J. Schutz. Institute for Tourism and Recreation Research Publications (2014). Bicycle Tourism: Providing Economic Development Opportunities for Montana. Available at https://scholarworks.umt.edu/cgi/viewcontent.cgi?article=1322&con- text=itrr_pubs and https://scholarworks.umt.edu/cgi/viewcontent.cgi?article=1225&context=itrr_pubs.
County Health Rankings and Roadmap. Multi-component Workplace Supports for Active Commuting. Available at http://www.countyhealthrankings. org/take-action-to-improve-health/what-works-for-health/policies/multi-component-workplace-supports-for-active-commuting.
O. Tristan Mytton, J. Panter, and D. Ogivie. Preventive Medicine (March 2016). Longitudinal Associations of Active Commuting with Wellbeing and Sickness Absence. Available at https://www.ncbi.nlm.nih.gov/pmc/articles/PMC4766368.
N. C. Page and V. O. Nilsson. Frontiers in Psychology (2016; Published online January 10, 2017). Active Commuting: Workplace Health Promotion for Improved Employee Well-Being and Organizational Behavior. Available at https://www.ncbi.nlm.nih.gov/pmc/articles/PMC5222872/ (“a more frequent active commute was positively associated with more productive organizational behavior and stronger overall positive employee well-being; whereas a longer passive commute was associated with poorer well-being, although there was no impact on organizational behavior”)
The League of American Bicycle Friendly Business application data (Summer 2015-Fall 2017).
National Center for Transit Qualified Transportation Fringe Benefits Summary Table (last updated 11/2/2018). Available at https://www. nctr.usf.edu/programs/clearinghouse/commutebenefits/.
Frontier Group and Transit Center (2017). Who Pays for Parking? How Federal Tax Subsidies Jam More Cars into Congested Cities, and How Cities Can Reclaim Their Streets. Available at http://transitcenter.org/publications/who-pays-for-parking.
See Chapter IV: Show Your Data I: Nation for discussion of federal funding for bicycling and walking.
K. McLeod. League of American Bicyclists (2017). Bike Commuter Benefit and Tax Reform. Available at http://bikeleague.org/sites/default/files/Bike-Benefit&TaxReform.pdf.
See Chapter IV: Show Your Data I: Nation for discussion of federal funding for bicycling and walking.
K. McLeod. League of American Bicyclists (2017). Bike Commuter Benefit and Tax Reform. Available at http://bikeleague.org/sites/default/files/Bike-Benefit&TaxReform.pdf.
The League of American Bicycle Commuter Benefit. Available at https://bikeleague.org/content/bicycle-commuter-benefit.
Association for Commuter Transportation. Getting to Work: Spotlight on Employer-sponsored commuter programs (January 2017). Available at http:// actweb.org/wp-content/uploads/2017/01/Getting-to-Work-Jan-2017-Final.pdf. (quoting Nick Amatuzzi, Senior Financial Analyst and Commuter Program Manager at MITRE)
M. Gerard. National Benefit Services (December 21, 2017). Newly Passed Tax Cuts and Jobs Act Eliminates Employers’ Commuter Benefits Deductions. Available at https://www.nbsbenefits.com/newly-passed-tax-cuts-and-jobs-act-eliminates-employers-commuter-benefits-deductions.
Joint Committee on Taxation. JCX-65-17 (December 11, 2017), Comparison Of The Revenue Provisions Contained In R.1, The “Tax Cuts And Jobs Act,” As Passed By The House Of Representatives, And As Amended By The Senate. Available at https://www.jct.gov/publications. html?func=startdown&id=5049.
The League of American Bicycle Friendly Business application data (2009-Fall 2017).
The League of American Bicycle Friendly Business application data (2009-Fall 2017).
Bike2Work. Commuting: Who Pays the Bill (October 2014) at 12-13. Available at http://www.bike2work-project.eu/en/upload/Resources_Down- loads/141117%20Commuting-%20%20Who%20Pays%20The%20Bill_2.pdf or http://www.bike2work-project.eu/en/Resources/Library/.
L. Ecola and M. Wachs. The RAND Corporation. U.S. DOT for Federal Highway Administration (December 2012). Exploring the Relationship between Travel Demand and Economic Growth. Available at https://www.fhwa.dot.gov/policy/otps/pubs/vmt_gdp/index.cfm.
B. McMullen and M. Eckstein. Transportation Research Record 2297 (2012). Relationship Between Vehicle Miles Traveled and Economic Activity. Available at http://citeseerx.ist.psu.edu/viewdoc/download?doi=10.1.1.404.6864&rep=rep1&type=pdf.
B. McMullen and M. Eckstein. Transportation Research Record 2297 (2012). Relationship Between Vehicle Miles Traveled and Economic Activity. Available at http://citeseerx.ist.psu.edu/viewdoc/download?doi=10.1.1.404.6864&rep=rep1&type=pdf.
B. McMullen and M. Eckstein. Transportation Research Record 2297 at p. 28 (2012). Relationship Between Vehicle Miles Traveled and Economic Activity. Available at http://citeseerx.ist.psu.edu/viewdoc/download?doi=10.1.1.404.6864&rep=rep1&type=pdf.
C. McCahill. State Smart Transportation Initiative (May 8, 2017). VMT Growth Continued, Slowed in 2016. Available at https://www.ssti.us/2017/05/ vmt-growth-continued-slowed-in-2016
L. Ecola and M. Wachs. The RAND Corporation. U.S. DOT for Federal Highway Administration (December 2012). Exploring the Relationship between Travel Demand and Economic Growth. Available at https://www.fhwa.dot.gov/policy/otps/pubs/vmt_gdp/index.cfm.
L. Ecola and M. Wachs. The RAND Corporation. U.S. DOT for Federal Highway Administration (December 2012). Exploring the Relationship between Travel Demand and Economic Growth (under the section “Directions for Future Research”). Available at https://www.fhwa.dot.gov/policy/otps/pubs/vmt_gdp/index.cfm.
Association for Commuter Transportation. How Seattle Increased Economic Development But Not VMT (January 9, 2018). Available at http://actweb.org/how-seattle-increased-economic-development-but-not-vmt.
K. Gibbs, S. J. Slater, N. Nicholson, D. C. Barker, and F. J. Chaloupka. Bridging the Gap Program, Health Policy Center, Institute for Health Research and Policy, University of Illinois at Chicago (2012). Income Disparities in Street Features that Encourage Walking. Available at http://www.bridg- ingthegapresearch.org/_asset/02fpi3/btg_street_walkability_FINAL_03-09-12.pdf.
Elizabeth Flanagan, Ugo Lachapelle, and Ahmed El-Geneidy. Research in Transportation Economics (August 2014). Riding tandem: Does cycling infrastructure investment mirror gentrification and privilege in Portland, OR and Chicago, IL? Available at https://ideas.repec.org/a/eee/retrec/v60y- 2016icp14-24.html.
M. Fenton. American Walks. Equity, Gentrification, and Building More Walkable Communities. Available at http://americawalks.org/wp-content/ uploads/2016/06/AW_WC_Fenton-Equity-Policies.pdf.
Puget Sound Regional Council, Growing Transit Communities Partnership. Value Capture Financing in Washington (February 2013) at p. Available at https://www.psrc.org/sites/default/files/valuecapturefinancingreport113-printing.pdf.
League of American Quality Bike Products Health and Well-being Program (2011). Available at https://bikeleague.org/sites/default/files/ quality_bike_products_health_reward_program.pdf.
G. P. Whitfield, L. A. Meehan, N. Maizlish, and A. M. Wendel. Journal of Transportation Health (June 2017; 5:172-18). The Integrated Transportation and Health Impact Modeling Tool in Nashville, Tennessee, USA: Implementation Steps and Lessons Learned. Available at https://www.ncbi.nlm.nih.gov/ pubmed/27595067.
BBC Research and Consulting, State of Colorado. Prepared for Colorado Office of Economic Development and International Trade. Economic and Health Benefits of Bicycling and Walking in Colorado: 2016 Report (Section I, 4). Available at https://www.codot.gov/programs/bikeped/building-a-bike-ped-friendly-community/bike-walk-study/assets/report-economic-and-health-benefits-of-bicycling-and-walking-in-colorado-2016-report/view.