IN THIS SECTION, THE BENCHMARKING REPORT DISCUSSES TOPIC THAT LOOK AT CHANGING PERCEPTIONS ABOUT THE APPROPRIATE GOALS FOR TRANSPORTATION BY STRESSING CONNECTIVITY AND/OR ACCESSIBILITY OVER LONG-HELD METRIC OF MOBILITY. THIS GENERALLY MEANS PROMOTING TRANSPORTATION NETWORKS THAT PROVIDE MORE WAYS TO ACCESS PLACES WITHIN COMMUNITIES WITHIN A REASONABLE TIME RATHER THAN NETWORKS THAT MOVE PEOPLE FASTER OVER LONGER DISTANCES.
Use this section to find out about accessibility and connectivity efforts and how bicycling and walking can help better connect communities.
Making the Case: Moving from How Far & How Fast to Why & Whether Trips Are Made
- The Case for Focusing on Short Trips
- The Case for Improving Mobility of Households Without Private Cars through Connectivity
- The Case for Identifying & Addressing Missing Links to Increase Connectivity
Advancing Understanding: New Metrics Needed for Mobility
Embracing Equity: Connecting with Communities, Not Metrics
Making the Health Connection: Physical Activity Is Improved by Connectivity & Access
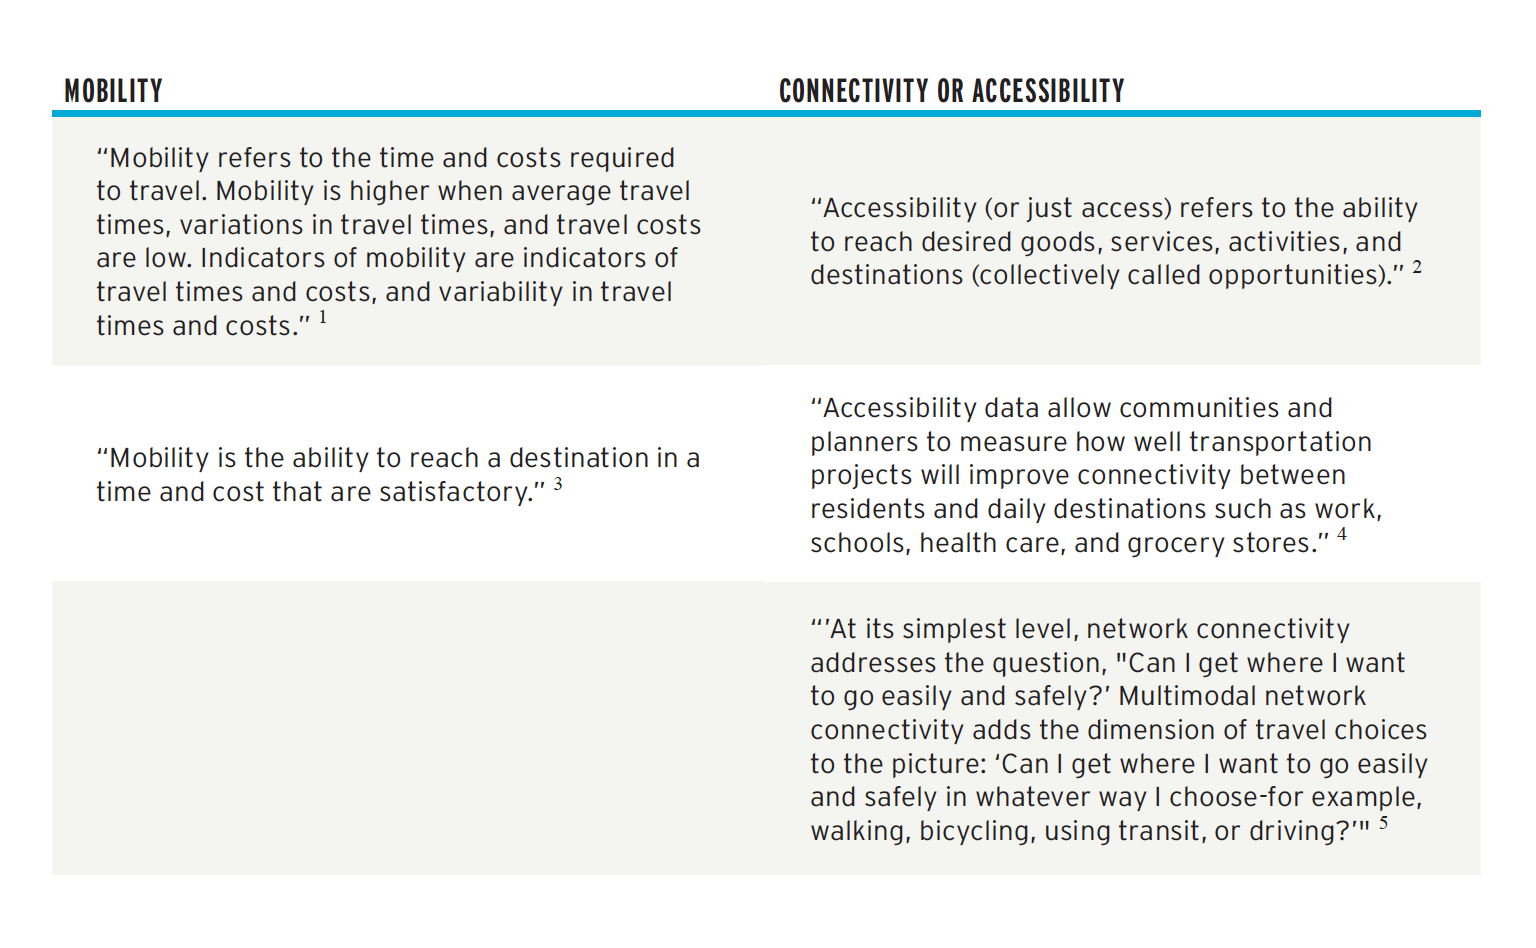
Connectivity is an important part of biking and walking. To understand connectivity as a goal, it is important to think about the aims of a transportation system. For years, one of the primary goals of transportation agencies has been mobility. This section will focus on the community benefits emphasizing connectivity or accessibility.
Below are some definitions of mobility, connectivity, and accessibility that may help you understand the differences among these terms and how those differences might affect perceived success for an agency that embraces one term or another as its performance metric.
An example of how mobility has been central to transportation in the United States can be found in the Federal Highway Administration’s mission statement: “[t]o improve mobility on our Nation’s highways through national leadership, innovation, and program delivery.” When assessing performance of this mission, FHWA uses the statistic of Travel Time Reliability 6 as expressed through the Travel Time Index, “the ratio of the peak-period travel time to the free-flow travel time.” 7 Texas A&M University (TAMU) Transportation Institute’s Urban Mobility reports based on the Travel Time Index (TTI) have existed for 20 years, and FHWA’s Urban Congestion Reports have been published since 2009. 8
According to a 2015 U.S. DOT white paper, “No national standard or database exists to measure the performance of the transportation system based on access or connectivity for residents or employees.” 9 TAMU recognizes there is a lack of connectivity or accessibility measures focused on access or total travel time for all users and a lack of sufficient data to estimate the travel times for all users. This lack of data is unfortunate as researchers at TAMU report that “[d]oor-to-door travel time… is best described with accessibility measures.” 10 According to researchers at TAMU, “There are few datasets at the national or regional level that provide travel by bicycle and walk modes or the share of work at home ‘trips.’ The ideal data [are] a combination of individual travel surveys for each development pattern type and additional count data for alternative modes” 11 This is in clear contrast to motor vehicle data, which is well developed and whose monitoring has been an institutional goal of federal, state, and local transportation agencies for decades.
MAKING THE CASE: MOVING FROM HOW FAR & HOW FAST TO WHY & WHETHER TRIPS ARE MADE
The Case for Focusing on Short Trips
Short trips are often the best opportunities to walk or bike. 12 According to the 2017 National Household Travel Survey completed by the Federal Highway Administration, 93.8% of walking trips are under 2 miles, and 79.6% of biking trips are under 3 miles. 13 Overall, 47.1% of all trips are shorter than 3 miles. 14 These distances can be walked or biked in 15 minutes or less and have policy implications.
When planning for transit station access, the Federal Transit Administration has defined that “all pedestrian improvements located within one-half mile and all bicycle improvements located within three miles of a public transportation stop or station shall have a de facto physical and functional relationship to public transportation.” 15 According to the policy, these distances are measured “as the crow flies,” rather than according to distances capable on existing bicycle and pedestrian networks.
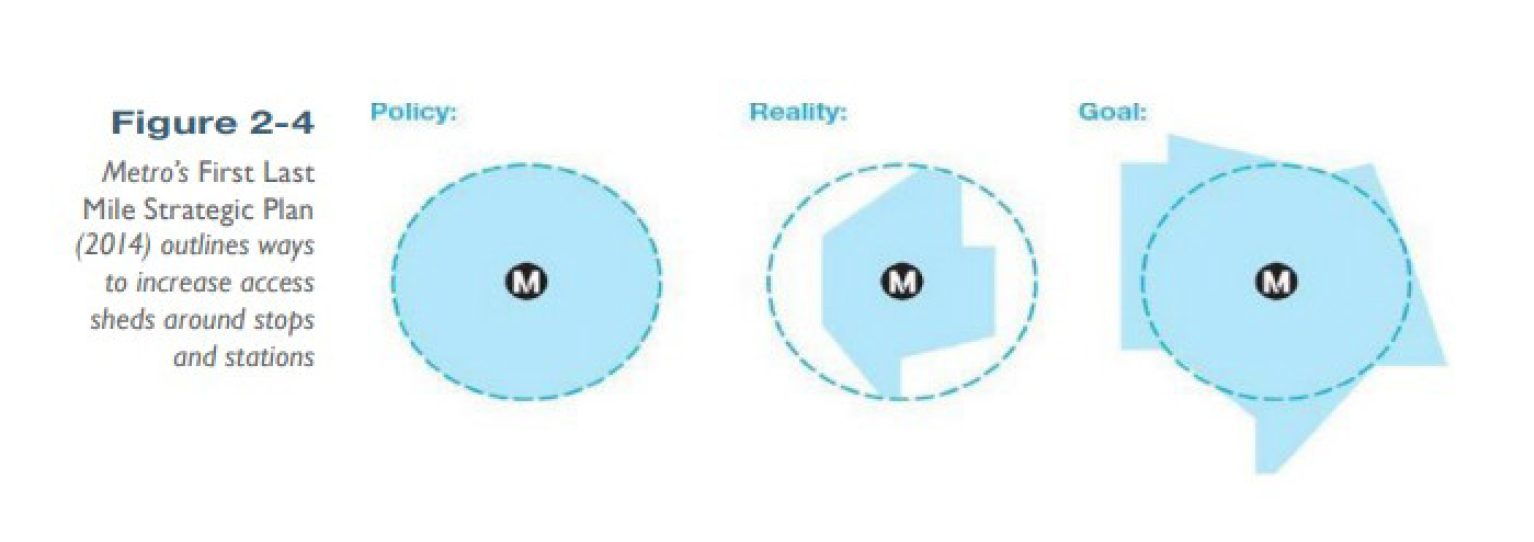
This policy can be visualized in Figure 3.4.2, which shows how the Los Angeles County Metropolitan Transportation Authority (LA Metro) has interpreted it. The policy, as provided by FTA, shows a circle for access to stations, but “[i]n reality this access shed is compromised by the street grid, breaks in the access network, location and number of street crossings, and fluctuations in average speed of pedestrians due to crossing characteristics and sidewalk conditions.” 16 The goal of LA Metro is to “coordinate infrastructure investments in station areas to extend the reach of transit, with the ultimate goal of increasing ridership.” 17
Footnote 18
While data and policy tell us that people will make short trips by biking and walking, these trips can encounter a variety of barriers. Physical barriers might include railways, highways, and waterways; high-speed roadways without pedestrian or bicyclist infrastructure; and long distances, both from origin to destination and imposed by a lack of safe or legal crossings. These barriers are an ideal place to focus interventions aimed at improving connectivity or accessibility such as integrating transportation and land use planning, reducing distances between key destinations, and improving local pedestrian and bicycle infrastructure. 19 Each of these interventions can reduce the time needed by people biking and walking to access community resources via short trips.
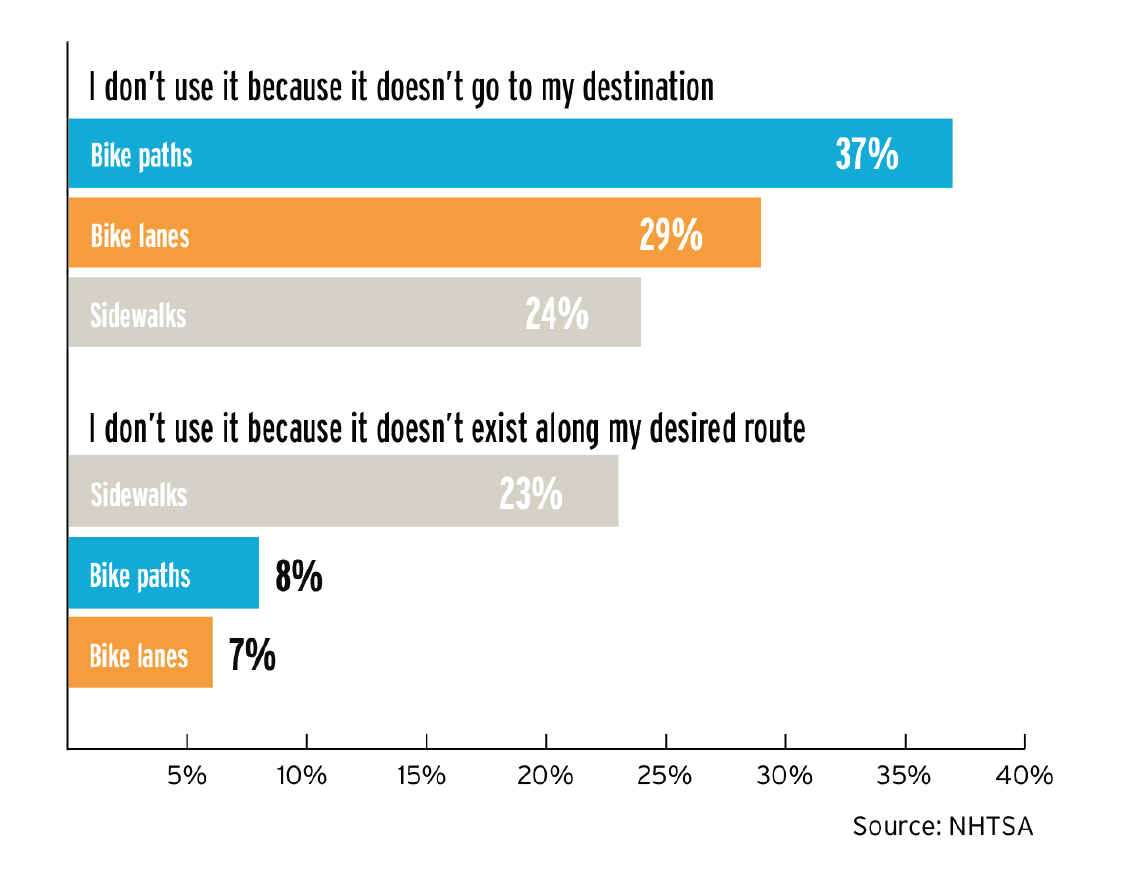
When people communicate that bicyclist and pedestrian infrastructure goes unused, they may miss the barriers and lack of connectivity that prevent its use. A recent study of bicyclist and pedestrian attitudes and behaviors, conducted by National Highway Traffic Safety Administration (NHTSA), found that the most common reason for not using a nearby bike path, bike lane, or sidewalk was that the facility did not go where the traveler needed to go. 20
Similarly, the second highest reason reported for not using sidewalks was that they did not exist along the desired route. 21 This type of data suggest that improved wayfinding (which provides signage that shows where people can go on bicycle or pedestrian infrastructure) and more comprehensive networks (so bicycle and pedestrian infrastructure exists along desired routes) may be effective at increasing biking and walking, and the use of bicyclist and pedestrian infrastructure.
Footnote 22
The Case for Improving Mobility of Households Without Private Cars Through Connectivity
Several types of households may lack private cars and face mobility challenges: 1) older adults who have lost the ability to drive, 2) lower-income households that lack ability to pay the costs associated with a private vehicle or choose to prioritize other expenses, 23 3) youth without a driver’s license, and 4) certain disabled populations. 24 According to the American Public Health Association, “Nearly one-third of the U.S. population—including children, older adults, people with disabilities, low- income people, women, and rural residents—are transportation disadvantaged (e.g., they are unable to transport themselves or purchase transportation). ” 25
Improving connectivity for people without access to a private car can take a variety of interventions, depending on existing connectivity options and reasons for lacking access to a private car. In some cases, lack of access to a private car may be a choice made by persons in a household because of sufficient existing connectivity and transportation options. In other cases, lack of access to a private car may mean significantly reduced ability to access opportunities compared to people with access to a private car. In that case, interventions could likely focus on improving connectivity and transportation options, including walking, biking, transit, and shared mobility services.
A 2011 report by the Brookings Institution found that the typical zero-vehicle household can reach 40.6% of metropolitan jobs. 26 However, the reported noted a sharp difference in the number of jobs that could be reached by zero-vehicle households in cities vs. suburbs. Zero-vehicle households that are in cities, were found to be able to reach 47.1% of metro-area jobs, almost twice the amount of jobs reachable for zero- vehicle households in suburban areas (25.8% of metro-area jobs). 27 In 2014, the U.S. Department of Housing and Urban Development published a guidebook for improving transportation connections for low- and moderate-income households in small and mid-sized cities that included a focus on improving bicycling and walking connections and committed affordable housing in denser areas. 28
The Case for Identifying & Addressing Missing Links to Increase Connectivity
Our current built environment places difficult obstacles in the paths of people who would like to bike and walk. Several analyses using Level of Traffic Stress methodologies have found that low-stress bicycle facilities are often isolated from each other by high-stress roads, intersections, or limited-access highways. 29 In one example, Montgomery County, a Maryland county in the Washington, DC metro area, analyzed over 3,500 miles of streets and trails and found that “while three-quarters of the network qualifies as a low-stress environment, these low-stress areas form ‘islands of connectivity’ separated by major highways and other high-speed roads.” 30
Providing connections between existing networks can provide a great improvement for accessibility. In one example, Madison, Wisconsin, found that an overpass or underpass of a limited-access highway could increase access to jobs, shops, and other opportunities within a 15-minute bike ride for more than 5,000 households. 31
Identifying and addressing missing links in bicycle and pedestrian networks can also be effective ways of increasing the potential access to transit. In one example, planners for the Washington Metropolitan Area Transit Authority found that a large number of people driving to a park and ride lot lived within one to three miles of the lot. 32 The proposed reasons for this choice, which prevents people who live further away from using the lot, included a fast-moving multi-lane road bordering the lot, and no direct access except by walking or biking along that fast-moving road. The agency determined that a pathway that provided an alternative access point would bring 1,200 households within a half-mile walk or ride of the transit station, representing potentially $300,000 in transit fare revenue each year. 33 Similar patterns of limited station access can be observed at many transit stations, leading to renewed interest in station evaluation studies and improving biking and walking networks around transit. 34

Footnote 35
ADVANCING UNDERSTANDING: NEW METRICS NEEDED FOR MOBILITY
Federal, state, and local agencies that have developed planning, engineering, and design processes based on available mobility metrics cannot move to new accessibility and/or connectivity metrics overnight. This overarching process has at least three sub-processes:
- RECOGNIZING THE NEED AND OPPORTUNITY for connectivity standards or other non-mobility performance measures
- CREATING, STANDARDIZING, AND PROMOTING new connectivity standards
- IDENTIFYING, EVALUATING, AND DETERMINING the continued need for the use of mobility standards or how mobility standards and newer connectivity standards could be weighed in public and expert debates about transportation improvements.
| FEDERAL, STATE, AND LOCAL AGENCIES that have developed planning, engineering, and design processes based on available mobility metrics cannot move to new accessibility and/ or connectivity metrics overnight. |
This process can be seen in a recent report from the U.S. Department of Transportation (DOT) that discussed a “number of states, MPOs, and industry groups are working to develop and implement new performance metrics distinct from the traditional automobile level of service (LOS) model. 36 ” Each of the case studies begins by stating a “Case for Change,” 37 moving into discussion of implementation and application of performance measures. Lastly, the “Insights and Lessons Learned” concludes with a summary of how the agency’s experience with new performance metrics affects its continued use of traditional mobility metrics.
It is worth noting that the U.S. DOT spends time discussing misconceptions about how mobility measures are embedded in transportation policy, stating, “No federal highway design regulations require the use of [level of service] targets explicitly…. [G]uidance in the Green Book and [Highway Capacity Manual] may be misinterpreted by some state and local transportation experts and decision makers, who may mistakenly perceive the use of LOS alone as federally required.” 38
This suggests that many agencies have yet to take the step of recognizing the need and opportunity for new metrics, or they believe they are constrained from following those metrics. For bicycling and walking, the Federal Highway Administration has supported development of multimodal connectivity metrics by looking at various possible metrics such as Bicycle Level of Service, Bicycle Level of Traffic Stress, Bicycle Low-Stress Connectivity, Bicycle Route Quality Index, Pedestrian Index of the Environment, Pedestrian Level of Service, and Pedestrian Level of Traffic Stress. 39
These types of performance measures have been included in proposed legislation such as The Transportation Access and System Connection Act of 2017. 40 The act would create a pilot project to make accessibility data available to five states and 10 metropolitan areas (including six smaller Metropolitan Planning Organizations) to test how that data can be used to optimize transportation systems across modes and communities. 41 This diversity of possible metrics presents a challenge, since standards are not yet set, and communities may be concerned about basing their work on a metric that has not been standardized.
EMBRACING EQUITY: CONNECTING WITH COMMUNITIES, NOT METRICS
Most of this chapter has focused on mobility and accessibility issues through the lens of developing quantitative tools to be used by experts. Other qualitative data can inform mobility and accessibility issues.
While the process of developing expert tools for transportation is important for relevant agencies, consultants, and other experts, it cannot be the only part of the shift of focus from mobility to something broader than how far and how fast people can travel. A recent poll found that 53% of Americans agreed with the statement, “Everyday Americans understand what the government should do better than the so-called ‘experts.’” 42 Awareness of current views provides organizations working to improve transportation and communities an opportunity to work to promote new expert systems and engage communities, so that new metrics reflect the needs of communities.
Traditional emphasis on transportation planning and engineering expertise has often been criticized by impacted communities as ignoring historic community distrust of and disillusionment with government agencies. This is particularly acute when they use approaches that have sometimes been characterized as decide, announce, defend.
As biking and walking partners work with agencies to develop new mobility measures focused on connectivity and accessibility, it is important to not simply replace one form of non-inclusive data-driven decision-making for another.
MAKING THE HEALTH CONNECTION: PHYSICAL ACTIVITY IS IMPROVED BY CONNECTIVITY & ACCESS
Connectivity and access are two interventions promoted by The Guide to Community Preventive Services (Community Guide), which collects evidence-based findings of the Community Preventive Services Task Force (CPSTF). 43 To improve physical activity, the Community Guide recommends built environment strategies that combine one or more interventions to improve pedestrian or bicycle transportation systems with one or more land use and environmental design interventions to increase physical activity. 44 The strategies recommended include the following:
These intervention suggestions are based on an evidence review that looked at 90 studies and found that transportation system improvements and land use and environmental design interventions alone do not have the same robust positive effects on physical activity as combined approaches. 45
An example of effective application of the above intervention strategies is the Minnesota Walks collaboration between the Minnesota Department of Transportation and Minnesota Department of Public Health. 46 This collaboration identified a goal to “[b]etter coordinate multimodal transportation networks and land use decisions to improve characteristics of the built environment that impact walking, such as design and the location of destinations” and provided 17 strategies for state, regional, and local entities to pursue in pursuit of that goal. 47 These strategies involved land use regulations, such as eliminating minimum parking requirements, and transportation system improvements, such as investments in pedestrian infrastructure.
National Academy of Sciences. Key Transportation Indicators: Summary of a Workshop (2002), Chapter 3 (Mobility Indicators) at p. 16. Available at https://nap.edu/read/10404/chapter/4.
T. Litman. Victoria Transportation Institute. Measuring Transportation: Traffic, Mobility and Accessibility (March 1, 2011) at p. 5. Available at http:// www.vtpi.org/measure.pdf.
The Texas A&M University System. White Paper Prepared for the Urban Transportation Performance Measure Study by Texas Transportation Institute (May 2005). The Keys to Estimating Mobility in Urban Areas Applying Definitions and Measures That Everyone Understands at pp. 2-8. Available at https://static.tti.tamu.edu/tti.tamu.edu/documents/TTI-2005-2.pdf.
The League of American H.R. 4241: The Transportation Access and System Connection Act (2018). Available at http://bikeleague.org/sites/default/files/NBS18_FactSheet_HR4241.pdf
Federal Highway Guidebook for Measuring Multimodal Network Connectivity (February 2018). Available at https://www.fhwa.dot.gov/environment/bicycle_pedestrian/publications/multimodal_connectivity.
Federal Highway Key Outcome Measures – FHWA Strategic Plan (thru January 2017). Available at https://www.fhwa.dot.gov/policy/measurementplandata_january2017.pdf.
Federal Highway Administration, Operations Performance Measurements Office of Operations. Urban Congestion Reports. Available at https://ops.fhwa.dot.gov/perf_measurement/ucr.
Federal Highway Administration, Operations Performance Measurements Office of Operations. Urban Congestion Reports. Available at https://ops.fhwa.dot.gov/perf_measurement/ucr.
U.S. Department of Transportation. Transportation Connectivity White Paper (January 5, 2015). Available at p. 2 at https://cms.dot.gov/sites/dot.gov/ files/docs/Connectivity%20White%20Paper.pdf.
The Texas A&M University System. White Paper Prepared for the Urban Transportation Performance Measure Study by Texas Transportation Institute (May 2005). The Keys to Estimating Mobility in Urban Areas Applying Definitions and Measures That Everyone Understands at p. 4-3. Available at https://static.tti.tamu.edu/tti.tamu.edu/documents/TTI-2005-2.pdf.
T. Lomax and D. Schrank. Texas Transportation Institute for Mobility Measurement in Urban Transportation (August 2010). Developing a Total Trav- el Time Performance Measure: A Concept Paper at p. 2. Available at https://static.tti.tamu.edu/tti.tamu.edu/documents/TTI-2010-7.pdf.
Brian McKenzie. U.S. Census Bureau. Modes Less Traveled – Bicycling and Walking to Work in the United States: 2008-2012 (2014). Available at https://www.census.gov/prod/2014pubs/acs-25.pdf.
Federal Highway Administration. 2017 National Household Travel Survey data. Available at https://nhts.ornl.gov.
Federal Highway Administration. 2017 National Household Travel Survey data. Available at https://nhts.ornl.gov.
Federal Transit Administration [Docket No. FTA-2009-0052] Federal Register/Vol. 76, No.161 (August 19, 2011). Final Policy Statement on the Eligibility of Pedestrian and Bicycle Improvements under Federal Transit Law. Available at https://www.gpo.gov/fdsys/pkg/FR-2011-08-19/pdf/2011-21273. pdf.
LA Metro. First Mile, Last Mile Strategic Plan (2014). Available at https://media.metro.net/docs/First_Last_Mile_Strategic_Plan.pdf.
LA Metro. First Mile, Last Mile Strategic Plan (2014). Available at https://media.metro.net/docs/First_Last_Mile_Strategic_Plan.pdf.
Transportation Research & Education Center, Portland State University. Federal Transit FTA Rep-No. 0111. Manual on Pedestrian and Bicycle Connections to Transit (August 2017) at p. 17. Available at https://www.transit.dot.gov/sites/fta.dot.gov/files/docs/ research-innovation/64496/ftareportno0111.pdf.
U.S. Department of Transportation. Connectivity—Relationship to Public Health. Available at https://www.transportation.gov/mission/health/ connectivity.
National Highway Traffic Safety Administration. 2012 National Survey of Bicyclist and Pedestrian Attitudes and Behavior, Volume 2: Findings Report (October 2013). Available at http://www.nhtsa.gov/staticfiles/nti/pdf/811841b.pdf.
National Highway Traffic Safety Administration. 2012 National Survey of Bicyclist and Pedestrian Attitudes and Behavior, Volume 2: Findings Report (October 2013). Available at http://www.nhtsa.gov/staticfiles/nti/pdf/811841b.pdf.
National Highway Traffic Safety Administration. 2012 National Survey of Bicyclist and Pedestrian Attitudes and Behavior, Volume 2: Findings Report (October 2013). Available at http://www.nhtsa.gov/staticfiles/nti/pdf/811841b.pdf.
Center for Transit-oriented Development. Creating Connected Communities: A Guidebook for Improving Transportation Connections for Low- and Moderate-Income Households in Small and Mid-Sized Cities (April 2014). Available at http://www.huduser.org/portal/publications/pdf/Creating_pdf.
M. Fernald (Ed.). Joint Center for Housing Studies, Harvard University. Housing America’s Older Adults: Meeting the Needs of an Aging Population (2014). Available at http://www.jchs.harvard.edu/sites/jchs.harvard.edu/files/jchs-housing_americas_older_adults_2014.pdf.
American Public Health Association. Policy Number: Improving Health through Transportation—Land-Use Policies (November 10, 2009). Available at https://www.apha.org/policies-and-advocacy/public-health-policy-statements/policy-database/2014/07/31/08/21/improving-health-through-transportation-and-land-use-policies.
A. Tomer. Metropolitan Policy Program, Brookings. Transit Access and Zero—Vehicle Households (August 2011) at p. 6. Available at https://www. brookings.edu/wp-content/uploads/2016/06/0818_transportation_tomer.pdf.
A. Tomer. Metropolitan Policy Program, Brookings. Transit Access and Zero—Vehicle Households (August 2011) at p. 6. Available at https://www. brookings.edu/wp-content/uploads/2016/06/0818_transportation_tomer.pdf.
Center for Transit-oriented Development. Creating Connected Communities: A Guidebook for Improving Transportation Connections for Low- and Moderate-Income Households in Small and Mid-Sized Cities (April 2014). Available at http://www.huduser.org/portal/publications/pdf/Creating_pdf.
Fehr Peers. Multi-Modal Level of Service Toolkit. Bicycling Level of Traffic Stress (2014). Available at http://asap.fehrandpeers.com/wp-content/ uploads/2014/08/MMLOS-Tool-Level-of-Traffic-Stress.pdf (“Currently, most U.S. cities have “islands” of low-stress connectivity for bicycles, but these islands are separated by freeways, high-speed arterials, and other barriers that make bicycling unattractive to most ”)
Montgomery County Planning. Montgomery County Bicycle Master Plan; Appendix D: Level of Traffic Stress Methodology. Available at http://montgomeryplanning.org/wp-content/uploads/2017/11/Appendix-D.pdf.
The League of American Bicyclists. H.R. 4241: The Transportation Access and System Connection Act (2018). Available at http://bikeleague.org/sites/ default/files/NBS18_FactSheet_HR4241.pdf
PlanItMetro. Washington Metropolitan Area Transit Authority. South Ave Station Auto Access “Hotspots” (Planning Studies, May 13, 2013). Available at https://planitmetro.com/2013/05/13/southern-ave-station-auto-access-hotspots.
J. Carrington. Washington Metropolitan Area Transit Authority, Metro. Office of Planning. Connecting Communities through Walkable Station Areas. GIS in Transit Conference (September 3, 2015) at slide 22. Available at https://transitgis.org/download/URISA-GIS-In-Transit-JC-Presentation-2015-08- 26sm.pdf.
Transportation Research & Education Center, Portland State University. Federal Transit FTA Rep-No. 0111. Manual on Pedestrian and Bicycle Connections to Transit (August 2017) at p. 17. Available at https://www.transit.dot.gov/sites/fta.dot.gov/files/docs/research-innovation/64496/ftareportno0111.pdf.
Transportation Research & Education Center, Portland State University. Federal Transit FTA Rep-No. 0111. Manual on Pedestrian and Bicycle Connections to Transit (August 2017) at p. 14. Available at https://www.transit.dot.gov/sites/fta.dot.gov/files/docs/research-innovation/64496/ftareportno0111.pdf.
Office of Policy, Transportation Policy, U.S. Department of Transportation. Evolving Use of Level of Services Metrics in Transportation Analysis (December 7, 2017). Available at https://transportation.gov/office-policy/transportation-policy/level-service-case-studies.
Office of Policy, Transportation Policy, U.S. Department of Transportation. Evolving Use of Level of Services Metrics in Transportation Analysis (December 7, 2017). Available at https://transportation.gov/office-policy/transportation-policy/level-service-case-studies.
Office of Policy, Transportation Policy, U.S. Department of Transportation. Evolving Use of Level of Services Metrics in Transportation Analysis (December 7, 2017) at 3. Available at https://transportation.gov/office-policy/transportation-policy/level-service-case-studies.
Federal Highway Administration. Guidebook for Measuring Multimodal Network Connectivity (February 2018). Available at https://www.fhwa.dot.gov/ environment/bicycle_pedestrian/publications/multimodal_connectivity.
H.R.4241 — 115th Congress (2017-2018). The Transportation Access and System Connection Act of 2017. Available at https://www.congress.gov/ bill/115th-congress/house-bill/4241.
The League of American Bicyclists. H.R. 4241: The Transportation Access and System Connection Act (2018). Available at http://bikeleague.org/sites/ default/files/NBS18_FactSheet_HR4241.pdf
Huffington Post, Politics. Americans Don’t Think the Government Needs ‘Experts.’ December 8, Available at https://www.huffingtonpost.com/ entry/poll-civil-service-experts_us_5849d515e4b04c8e2baeede9.
The Community Community Preventive Services Task Force Findings. Available at https://www.thecommunityguide.org/task-force-findings.
The Community Understanding the Task Force Findings and Recommendations. Available at https://www.thecommunityguide.org/task-force/understanding-task-force-findings-and-recommendations.
The Community Task Force Finding and Rationale Statement (ratified December 2016). Physical Activity: Built Environment Approaches Combining Transportation System Interventions with Land Use and Environmental Design. Available at https://www.thecommunityguide.org/sites/de- fault/files/assets/PA-Built-Environments.pdf
Minnesota Departments of Transportation and Health. Minnesota Walks. Available at http://www.dot.state.mn.us/peds/plan/pdf/minnesota-walks-2017-final.pdf.
- Minnesota Departments of Transportation and Health. Minnesota Walks at pp. 26-27. Available at http://www.dot.state.mn.us/peds/plan/pdf/minnesota-walks-2017-final.pdf.