In this section, the Benchmarking Report examines who is involved in promoting bicycling and walking and how institutions engage citizens in transportation decision-making. As part of understanding the engagement process in bicycle and pedestrian planning, this section explores city and state goals related to biking and walking as reported in past Benchmarking Reports.
Use this section to understand agency and advocacy organization involvement in planning for a future where biking and walking are safe, comfortable, and accessible activities for everyone.
Making the Case: Moving to Better Public Engagement in Transportation
- The Case for Greater Transparency in Transportation Decision Making
- The Case for Bicycle & Pedestrian Planning
- The Case for Understanding Bicycle & Pedestrian Organizations
Advancing Understanding: Developing Goals & Benchmarks for Public Engagement
Embracing Equity: Adding to Person Typologies Used in Bike Advocacy
Footnote 1
MAKING THE CASE: MOVING TO BETTER PUBLIC ENGAGEMENT IN TRANSPORTATION
The Case for Greater Transparency in Transportation Decision Making
The federal process for decision-making is well-defined, with a 2017 report by the U.S. Department of Transportation clearly identifying which agencies/levels of government are responsible for different transportation- related plans. 2 However, data on these planning processes are frequently unavailable since only three of the eight steps identified in the transportation decision-making process have federally required public components. 3 This lack of public involvement and transparency at each step is consistent with an approach to transportation planning that is focused on serving the needs of agencies involved in the transportation planning process, rather than determining and addressing community needs. 4
The federal government has stated its intention to move to a more publicly engaged planning process. Under the Every Place Counts initiative, U.S. DOT created a toolkit meant to provide a plain-language explanation of the transportation decision-making process to help the public understand the planning process. 5 The Federal Highway Administration (FHWA) also published a guidebook for engaging low-literacy and limited-English-proficiency populations in transportation decision-making. 6
A recent report from Texas A&M presents best practices for public involvement in transportation decision-making with suggested methods and evaluation of public involvement. Rather than ”Decide, Announce, Defend,” the framework for public involvement in the report is “Observe, Interact, Incorporate.” The authors identified eight practices that can be applied to evaluate public participation processes:
- Coordinate expectations.
- Designate resources.
- Aim for fairness.
- Stay flexible.
- Distinguish outputs from outcomes.
- Use quantitative and qualitative measures consistently.
- Track results over time.
- Keep it simple—start small. 7
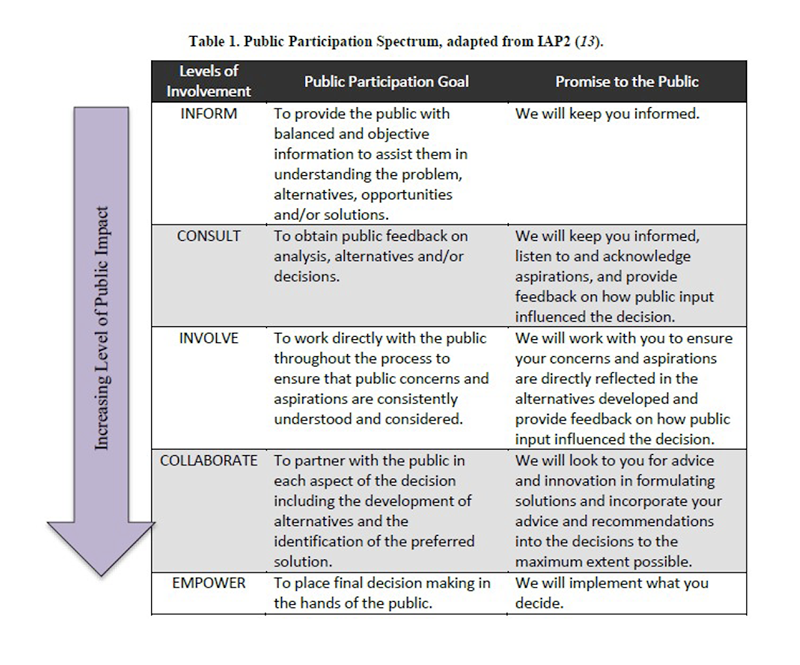
The authors also stressed the importance of coordinating processes and goals with public expectations. The chart below was adapted from the International Association for Public Participation and is meant to aid planners in articulating their public participation goals. The chart recognizes that measuring the performance of public participation depends on identified goals and that by selecting the level of involvement for a particular process, an agency can better craft how it measures success of its process. For the public, it may also be instructive to know what to expect from its public agency and how the agency sets its goals for public participation. 8
Footnote 9
The Case for Bicycle & Pedestrian Planning
The Benchmarking Report has focused on modal plans for biking and walking and has presented survey data on stated goals. These come with limitations because they have been collected over time using binary indicators rather than qualitative indicators. Benchmarking Report data can tell us about the presence of stated goals or plans but not the substance of those goals or plans regarding various issues.
Clear goals are important for public engagement because they can either reflect the input of the public or serve as an expression of the agency’s goal, providing the basis for public input. As noted in the FHWA’s Statewide Pedestrian and Bicycle Planning Handbook, “Public involvement provides the foundation for a good plan and planning process…. [The] public outreach component of the plan development can be as large as one-quarter to one-third of the total cost of the planning process.” 10
Benchmarking Report data on stated goals and master plan activities have revealed several interesting insights: Cities have been more likely to report stated goals about biking versus walking in every Benchmarking Report period. Between 2010 and 2014, this difference was at least 11 cities. In 2016, this gap had shrunk to six cities.
Cities have also been more likely to report a stated goal to reduce bicyclist fatalities than to reduce pedestrian fatalities. This gap is smaller than the gap observed for increasing bicycling and walking, but it is perhaps more worrying since pedestrian fatalities comprise a much larger number and percentage of traffic fatalities than bicyclist fatalities. Also notable is that stated goals for increasing bicycling and walking were more likely to be reported than stated goals to reduce bicyclist and pedestrian fatalities.
Benchmarking Report data also suggest that pedestrian master plans are much less common than bicycle master plans. At the city level, at least 20 cities reported having a bicycle master plan and no pedestrian master plan in each reporting period. 11 Cities with at least one of either a bicycle or pedestrian master plan comprised nearly 90% of Benchmarking Report cities cited in 2016.
The observed differences in stated goals and the bicycle and pedestrian master planning seen in cities are not seen in state-reported plans and goals. States were somewhat more likely to report pedestrian-oriented goals than bicycling- oriented goals. This difference in stated goals occurred despite bicycle master plans being more common than pedestrian master plans in each reporting period. At no time during the past Benchmarking Report periods did more than two-thirds of states report having a bicycle and/or pedestrian master plan.
Since the start of the Benchmarking Project,
- The number of city-reported pedestrian master plans has increased by 150% (from 16 to 40, including combined bike/ped master plans).
- The number of city-reported bicycle master plans has increased by 63% (from 38 to 62, including combined bike/pedestrian master plans).
- The number of state-reported pedestrian master plans has increased by 8% (from 24 to 26, including combined bike/ped master plans).
- The number of state-reported bicycle master plans has increased by 22% (from 27 to 33, including combined bike/ped master plans).
Benchmarking data reveals that cities tend to be more likely than states to pursue bicycle and pedestrian master planning but prefer bicycling-oriented goals to pedestrian-oriented goals. With stated goals and master planning being much more widespread than at the beginning of the Benchmarking Project, the next challenge is to dive into shared metrics across master plans and develop better monitoring systems for goals.
The Case for Understanding Bicycle & Pedestrian Organizations
The Alliance for Biking and Walking (Alliance) was founded in 1996 by 12 bicycling and walking advocacy organizations. Between 1996 and 2016, the Alliance grew from those initial member organizations, which had a total of 10 full-time employees, to more than 210 member organizations, employing 1,100 full-time workers. Despite this incredible membership growth, the Alliance ceased operations in 2016.
The League of American Bicyclists was founded in 1880 as an individual membership organization. The individual membership of the League was over 100,000 persons in 1898, but the League ceased operations twice between 1900 and 1965. Since 1965, the League has embarked on many projects, always keeping individual membership and the representation of bicyclists as its core values. Like the Alliance, the League has many member organizations engaged in bicycle advocacy. To understand how the League and Alliance members might differ, the League undertook a short survey based on the Alliance’s 2015 State of the Movement report.
The League has over 350 member organizations identified as advocacy groups and an additional 600 recreational riding clubs. The League’s State of the Movement survey received 43 responses. Similar to the Alliance’s data, the League’s member organizations primarily devote their activities to bicycling-related issues, with 98% of member organizations identifying bicycling issues as something they have worked on in the last year compared to 97% of Alliance respondents. League member organizations, according to survey responses, appear to work on both biking and walking issues at a higher rate than during the Alliance’s last survey, with 58% of respondents indicating they work on both issues versus 32% of Alliance respondents in 2015.
Much like Alliance members, League members also work at one scale, such as one city or within one state, with around 80% of League and Alliance members working at only one scale in both surveys. League members appear to be slightly more oriented toward state-level activities than Alliance members (44% versus 29%), although League membership data show that 83% of member advocacy organizations identify as local advocacy organizations.
Footnote 12
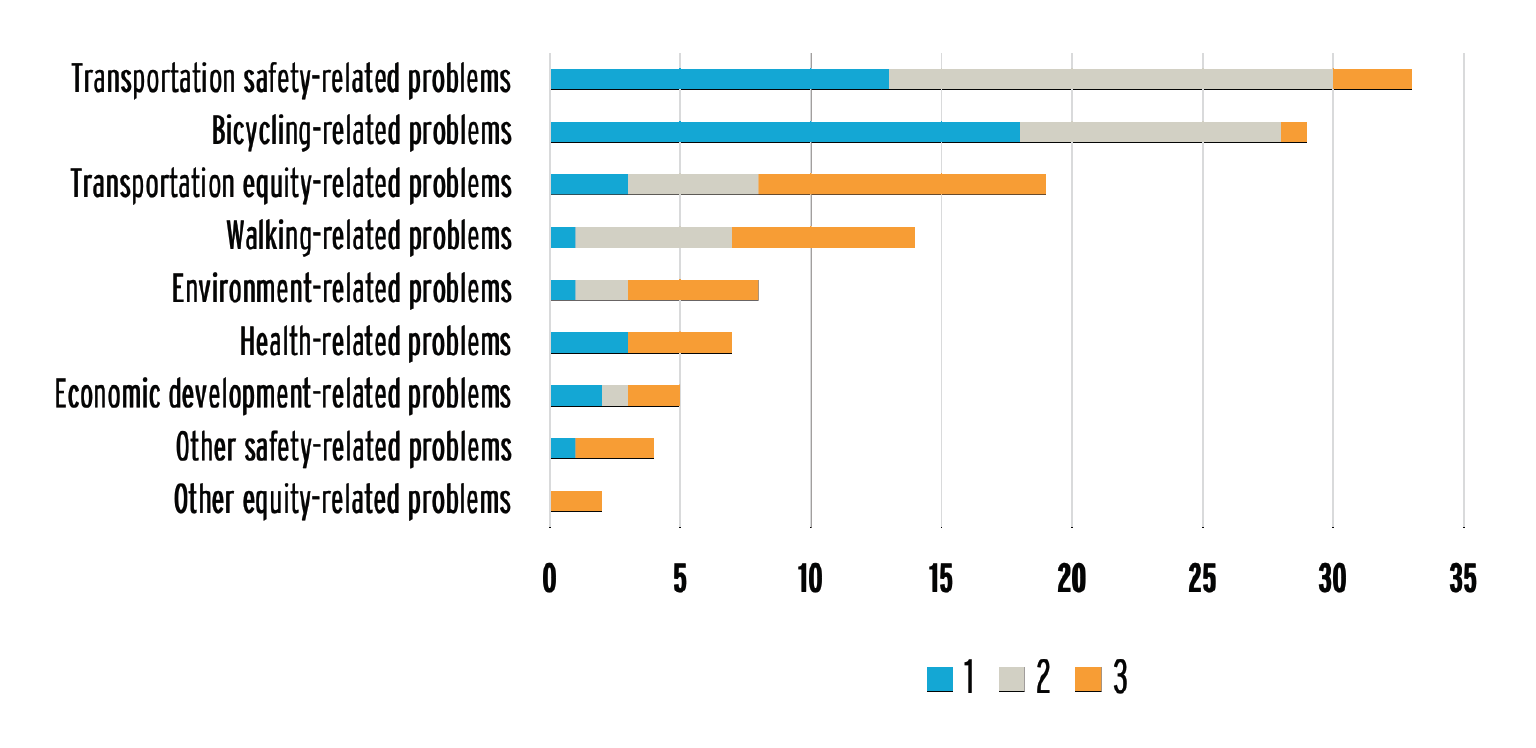
According to survey respondents, League member groups are highly motivated by bicycling-related problems and transportation safety-related problems, with one of these two motivations being the first most important motivation for 72% of respondents (health, transportation equity, and economic development were the only other motivations to get 5% or more).
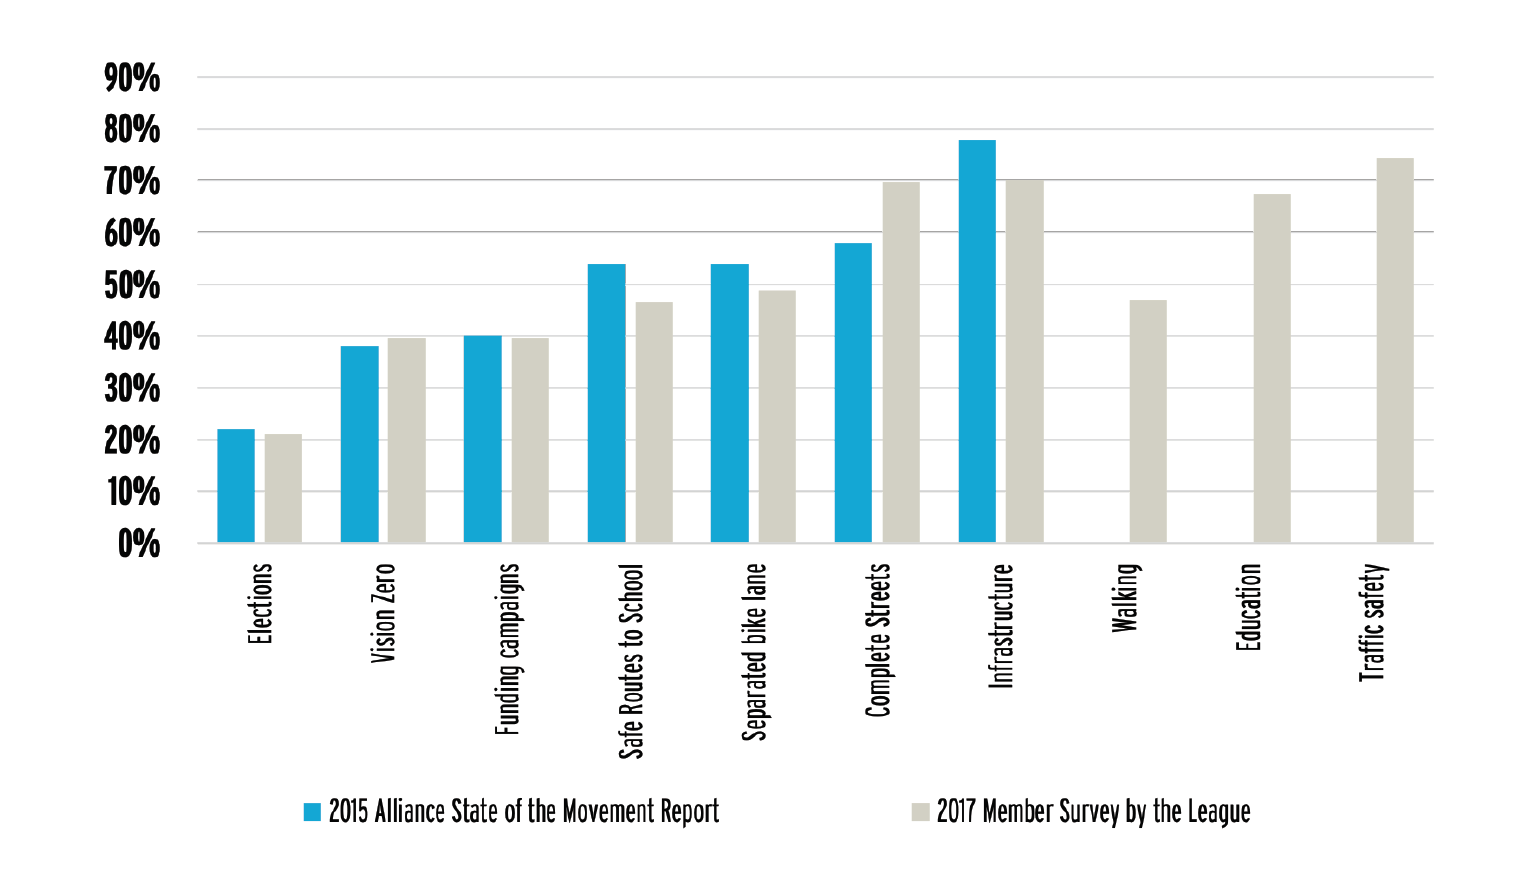
These motivations are reflected in campaign activities, with traffic safety campaigns the most reported campaign type among League member groups, followed by infrastructure, Complete Streets, and education. Compared to Alliance data from 2015, League member groups are more likely to pursue Complete Streets and Vision Zero campaigns than Alliance members in 2015. Overall, the campaigns and activities of League and Alliance member groups look broadly similar.
Continuing to monitor the activities and needs of local organizations that use data from the Benchmarking Report is important to ensure that the Benchmarking Report remains a relevant and useful resource.
Footnote 13
ADVANCING UNDERSTANDING: DEVELOPING GOALS & BENCHMARKS FOR PUBLIC ENGAGEMENT
The Benchmarking Report has not emphasized collection of state-of-practice data and best practices for federally required public involvement plans required by law for transportation planning and for environmental protection. 14 The closest that the Benchmarking Report has come to discussing this type of public involvement is reporting on Pedestrian and/or Bicycle Advisory Committees and Open Streets events.
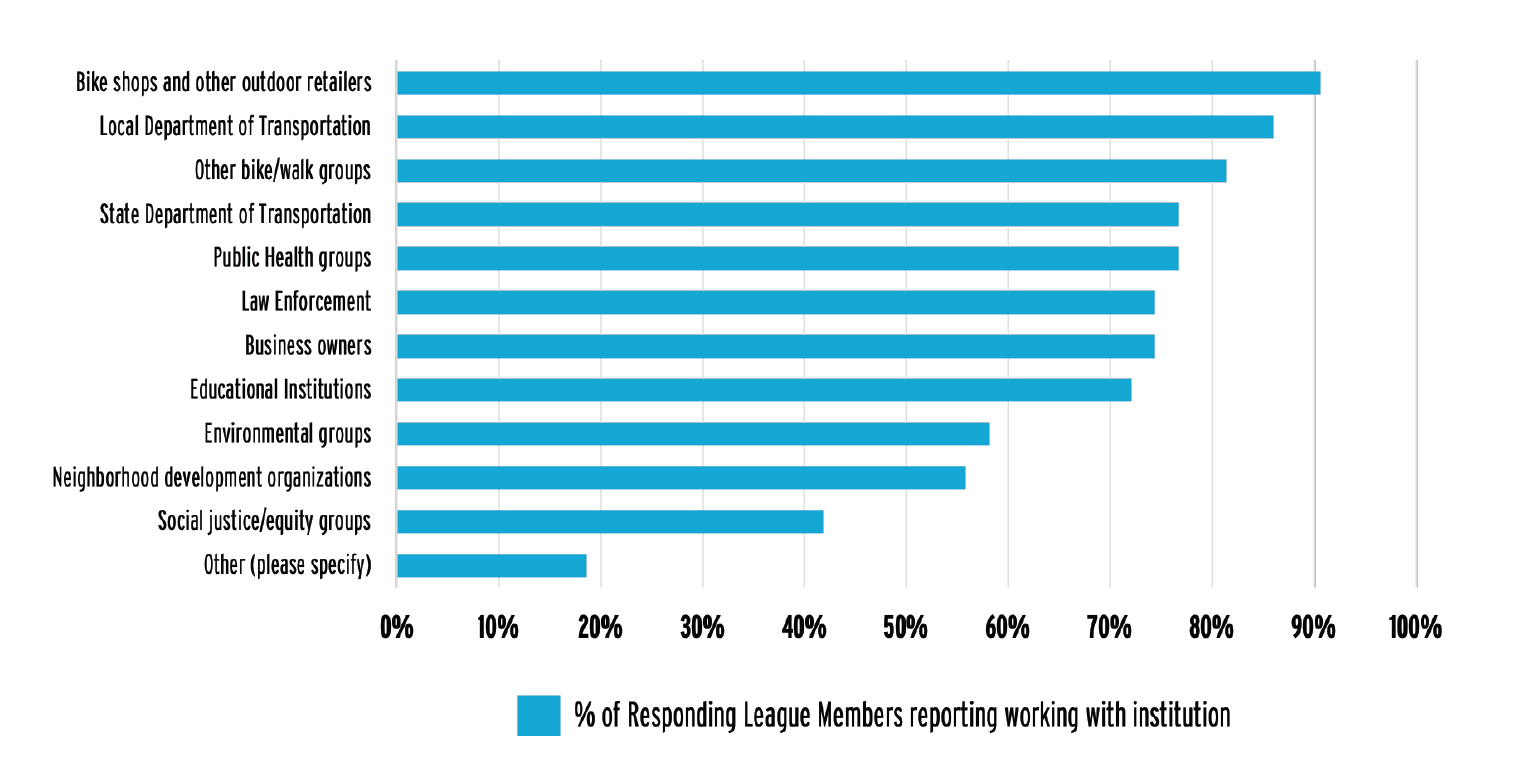
The League’s State of the Movement survey revealed a wide variety of institutions with which member organizations partner. Almost all League respondents said that they had worked with a bike shop in the last two years (91%), as well as local departments of transportation (86%), public health groups (77%), and state departments of transportation (77%). Despite a great interest in working with social justice and equity groups, those groups were the least likely partner group given as an option in the League’s survey, with 42% of respondents saying they had worked with such a group in the past two years.
Footnote 15
One of the challenges for developing benchmarks and shared understanding of good public involvement may lie in the diversity of groups with whom League member organizations work, State and local departments of transportation, for example, likely have far different public involvement cultures than public health groups or law enforcement.
In Europe, physical activity groups, obesity prevention groups, and others have joined with the European Cycling Federation to create the ActiveVoice project. 16 The intention of the ActiveVoice project is to build capacity of civil society organizations involved in health-enhancing physical activity. This type of cross-sector capacity building may be a useful model for the United States as biking and walking groups look for partners and a knowledge base for engaging in public policy processes.
EMBRACING EQUITY: ADDING TO PERSON TYPOLOGIES USED IN BIKE ADVOCACY
Recently, bicycle advocacy groups have focused on four typologies of people developed by Roger Geller in Portland. 17 Since their development in 2005, the four typologies have been studied nationally 18 and used as a basis for other research about improving bicycling. The development of these typologies was significant because it helped frame public engagement around meeting the expectations of a potential consumer group in addition to current members of organizations, who already likely already identified as bicyclists.
Footnote 19
This typology research found that a majority of people are “interested but concerned” and that the best ways to address the concerns of people who are “interested but concerned” is to intervene in the built environment. 20 This is seen in responses showing that more than half of “interested but concerned” persons fear being hit by a car while riding and that they also would be more likely to bike if bike lanes were physically separated by a barrier from cars. 21 These findings have helped push organizations to reach out more to occasional bicyclists and frame engagement around addressing their concerns through infrastructure.
The four bicyclist typologies do not appear to have been applied to people who walk. This may reflect that “everyone is a pedestrian” and that most people walk at some point during the day. Research on pedestrian typologies seems oriented toward route behavior. 22 Research on getting more people to walk more often seems to focus more on place then persons. While the four typologies have been helpful for bicycle partners, the typologies hold more limitations for pedestrians and others. Social justice organizations point out that the typologies are oriented towards one intervention—infrastructure—and may not address barriers that affect the mobility of all people. A focus on changing culture is also present in bicycle education programming such as the League of American Bicyclists’ Smart Cycling program, which builds confidence by teaching bicycle skills.
MAKING THE HEALTH CONNECTION: COMMUNITY-BASED PARTICIPATORY RESEARCH AS A MODEL FOR PUBLIC ENGAGEMENT
Community and public health organizations have developed Community-Based Participatory Research (CBPR) as a method that allows public engagement to shape research and programming when attempting to understand and change community health issues. According to the W.K. Kellogg Foundation, “CBPR begins with a research topic of importance to the community with the aim of combining knowledge and action for social change to improve community health and eliminate health disparities.’” 23
| CBPR BEGINS WITH A RESEARCH TOPIC OF IMPORTANCE TO THE COMMUNITY with the aim of combining knowledge and action for social change to improve community health and eliminate health disparities. |
According to an article published in the journal Advances in Nursing Science, characteristics of the CBPR approach include:
- recognizing the community as a unit of identity,
- building on the strengths and resources of the community,
- promoting co-learning among research partners,
- achieving a balance between research and action that mutually benefits both science and the community,
- emphasizing the relevance of community-defined problems,
- employing a cyclical and iterative process to develop and maintain community/ research partnerships,
- disseminating knowledge gained from the CBPR project to and by all involved partners, and
- requiring long-term commitment on the part of all partners. 24
Research suggests that CBPR approaches may be preferred by groups that have traditionally been underserved or have had a negative experience with government actions. For example, a 2005 article published in the journal Cancer Control states, “The majority of tribal Nations prefer, if not mandate, that CBPR be used in most proposed studies involving their communities today.” 25
The Tisch College Community Research Center at Tufts University uses CBPR in its Community Assessment of Freeway Exposure and Health, which has demonstrated that elevated levels of ultrafine particles next to highways and major roadways are associated with a higher risk of heart attack and stroke. 26 Rather than taking this finding and leaving the community, stakeholders pushed the researchers to help develop a protective zoning ordinance to address the observed risks.
Policylink recommends using tools such as walking and windshield tours, walkability assessment checklists, and other diagnostic tools that can be promoted with members of a community as part of a CBPR approach. 27
Stephen Bland. Mass Transit (March 7, 2014). New Approaches to Public Engagement. Available at http://www.masstransitmag.com/article/11316290/new-approaches-to-public-engagement.
U.S. Department of Transportation. Every Place Counts Leadership Academy-Transportation Toolkit at p. 27. Available at https://www.transportation. gov/sites/dot.gov/files/docs/ToolkitFinal2017.pdf
U.S. Department of Transportation. Every Place Counts Leadership Academy-Transportation Toolkit at p. 15. Available at https://www.transportation. gov/sites/dot.gov/files/docs/ToolkitFinal2017.pdf
U.S. Department of Transportation. Every Place Counts Leadership Academy-Transportation Toolkit at p. 12. Available at https://www.transportation. gov/sites/dot.gov/files/docs/ToolkitFinal2017.pdf. See also Ennio Cascetta and Francesca Procedia-Social and Behavioral Sciences (October 2013). Public Engagement for Planning and Designing Transportation Systems. Available at https://www.sciencedirect. com/science/article/pii/S1877042813040421.
U.S. Department of Transportation. Every Place Counts Leadership Academy-Transportation Toolkit at p. 27. Available at https://www.transportation. gov/sites/dot.gov/files/docs/ToolkitFinal2017.pdf
PBS&J for Federal Highway Administration. How to Engage Low-Literacy and Limited-English-Proficiency Populations in Transportation Decisionmaking (February 2006). Available at https://www.fhwa.dot.gov/planning/publications/low_limited/webbook.pdf.
Greg Griffin, Gretchen Stoeltje, Tina Geiselbrecht, Chris Simek, Ben Ettelman, Madison Metsker-Galarza. Texas A&M Transportation Institute. PRC 17-89 F (January 2018). Performance Measures for Public Participation Methods at pp. 7-8. Available at https://static.tti.tamu.edu/tti.tamu.edu/ documents/PRC-17-89-F.pdf.
Greg Griffin, Gretchen Stoeltje, Tina Geiselbrecht, Chris Simek, Ben Ettelman, Madison Metsker-Galarza. Texas A&M Transportation Institute. PRC 17-89 F (January 2018). Performance Measures for Public Participation Methods at p. 19. Available at https://static.tti.tamu.edu/tti.tamu.edu/ documents/PRC-17-89-F.pdf.
Greg Griffin, Gretchen Stoeltje, Tina Geiselbrecht, Chris Simek, Ben Ettelman, Madison Metsker-Galarza. Texas A&M Transportation Institute. PRC 17-89 F (January 2018). Performance Measures for Public Participation Methods at p. 20. Available at https://static.tti.tamu.edu/tti.tamu.edu/ documents/PRC-17-89-F.pdf.
U.S. Department of Transportation John A Volpe National Transportation Systems Center for the Federal Highway Administration. FHWA-HEP-14-051 (September 2014). Statewide Pedestrian and Bicycle Planning Handbook at p. 36. Available at https://www.planning.dot.gov/documents/Ped- Bike_State_Planning_Handbook.pdf.
Combined bike/pedestrian master plans were counted as both bicycle and pedestrian master plans. Data compiled from prior editions of the Benchmarking Report.
The League of American Bicyclists. 2017 State of the Movement member survey.
The League of American Bicyclists. 2017 State of the Movement member survey and The Alliance for Biking and Walking. The State of the Movement: Benchmarking biking and walking advocacy (November 2015). Available at https://bikeleague.org/sites/default/files/State_of_the_Movement_final.pdf.
For easy access to such documents see, Federal Highway Administration. DOT Public Involvement Reference Tool (current as of March 1, 2018). Available at https://www.fhwa.dot.gov/planning/public_involvement/reference_tool/.
The League of American Bicyclists. 2017 State of the Movement member survey.
European Cyclists’ Federation. ActiveVoice. Available at https://ecf.com/projects/activevoice.
Roger Geller, Bicycle Coordinator. Portland Department of Transportation. Four Types of Cyclists. Available at https://portlandoregon.gov/ transportation/article/264746.
Jennifer Dill, PhD. Portland State University. Types of Cyclists. Available at https://jenniferdill.net/types-of-cyclists/.
Alta Planning + Design. Medium.com (8/10/2017). Understanding the “Four Types of Cyclists.” Available at https://blog.altaplanning.com/understanding-the-four-types-of-cyclists-112e1d2e9a1b.
Jennifer Dill, PhD. Portland State University. Types of Cyclists. Available at https://jenniferdill.net/types-of-cyclists/.
Michael Andersen, Green Lane Project staff writer. People for Bikes (3/12/2015). Here are the First Ever National Findings About Interested But Concerned Bikers. Available at https://peopleforbikes.org/blog/here-are-the-first-ever-national-findings-about-interested-but-concerned-bikers/.
Alexandra Millonig and Norbert Brändle. UCPNavi project (Ubiquitous Cartography for Pedestrian Navigation) supported by the Austrian Funds for Scientific What Type of Pedestrian Are You? Walking Patterns and Route Preferences of Shoppers. Available at http://www.streetsblog.org/wp-content/uploads/2009/10/Walk21_2009_Poster_Millonig_Braendle.pdf (proposing four types of pedestrians based on their route preferences).
Community-Campus Partnerships for Health. Community-Based Participatory Research (quoting Kellogg Community Health Scholars Program (2001)). Available at https://depts.washington.edu/ccph/commbas.html.
Holkup, P.A., Tripp-Reimer, T., Salois, E. M., & Weinert, C. Advances in nursing science. (2004). Community-based participatory research: an approach to intervention research with a Native American community. Available at https://www.ncbi.nlm.nih.gov/pmc/articles/PMC2774214/.
Burhansstipanov, L, Christopher, S., & Schumacher, S. A. Cancer Control : journal of the Moffitt Cancer Center (2005). Lessons learned from community-based participatory research in Indian country. Available at https://www.ncbi.nlm.nih.gov/pmc/articles/PMC3544402/.
Jonathan M. Tisch College of Civic Life. Improving Public Health through Community-Based Research (11/4/2016). Available at https://tischcollege. tufts.edu/news/improving-public-health-through-community-based-research.
Policylink and U.C. Berkeley School of Public Health. A Report to the California Endowment (2012). Community-Based Participatory Research: A Strategy for Building Healthy Communities and Promoting Health through Policy Change. Available at http://www.policylink.org/sites/default/files/CBPR.