Use this section to discover mechanisms and programs used by federal transportation agencies to fund bicycling and walking projects. Originally printed as part of the 2018 Benchmarking Report on Bicycling and Walking in the United States, citations can be found in the pdf available at https://bikeleague.org/sites/default/files/Benchmarking_Report-Sept_03_2019_Web.pdf.
Making the Case: Understanding Transportation Governance Structures to Promote Biking & Walking
- The Governance Model of Federal Funding for Physical Infrastructure
- The Governance Model for Road Safety
- The Governance Model for Building Bicycling & Walking Infrastructure
Embracing Equity: Have Governance Structures Addressed the Legacy of ”Urban Renewal”?
Advancing Understanding: Explicit Transportation Hierarchies
‘[T]he concept of “governance” can be defined to include “elected and nonelected government officers, nongovernmental organizations, political parties, interest groups, policy entrepreneurs … [and other] relevant actors in the decision-making processes that produce government action.” The literature on governance is premised on the understanding that governance includes public and private players who collaboratively guide public policy and decision-making.
Many stakeholders are involved in transportation, and their relationships can often differ according to each state or community. The American Association of State Highway and Transportation Officials (AASHTO) lists at least 25 major stakeholders in transportation governance and finance, without listing major entities such as law enforcement, first responders, and the President of the United States.
This section introduces common transportation governance relationships relevant to either increasing bicycling and walking or making bicycling and walking safer through planning, designing, and building infrastructure. This is not intended to be an exhaustive discussion of each stakeholder and its relationship to other entities regarding public policy and decision-making.
MAKING THE CASE: UNDERSTANDING TRANSPORTATION GOVERNANCE STRUCTURES TO PROMOTE BIKING & WALKING
The Governance Model of Federal Funding for Physical Infrastructure
Most of America’s built environment is created by three public-sector actors: 1) the federal government, 2) the state governments, and 3) local/regional governments. Interest has also grown in involving private-sector entities in project financing, development, maintenance, and operation.
For most federal transportation funding, the funding governance process looks like the following:
The next two pages provide flowcharts of the Surface Transportation Block Grant Program and the Transportation Alternatives Program. Together, these two programs have provided more than half of the federal funds used for bicycling and walking projects and programs in recent years.

The Surface Transportation Block Grant Program (STBGP) is one of the biggest and most flexible federal funding sources. Under the FAST Act, an increasing amount of STBGP is sub-allocated to local communities. This makes it an attractive source for bicycling and walking investment. Aside from transportation alternatives funds, STBGP is often used for bicycling, walking and multimodal projects due, in part, to the fact that more than 50 percent of STBGP is sub-allocated to local communities of all sizes. In addition, STBGP is one of the few programs that allows funding be spent on bicycle non- infrastructure projects such as education.
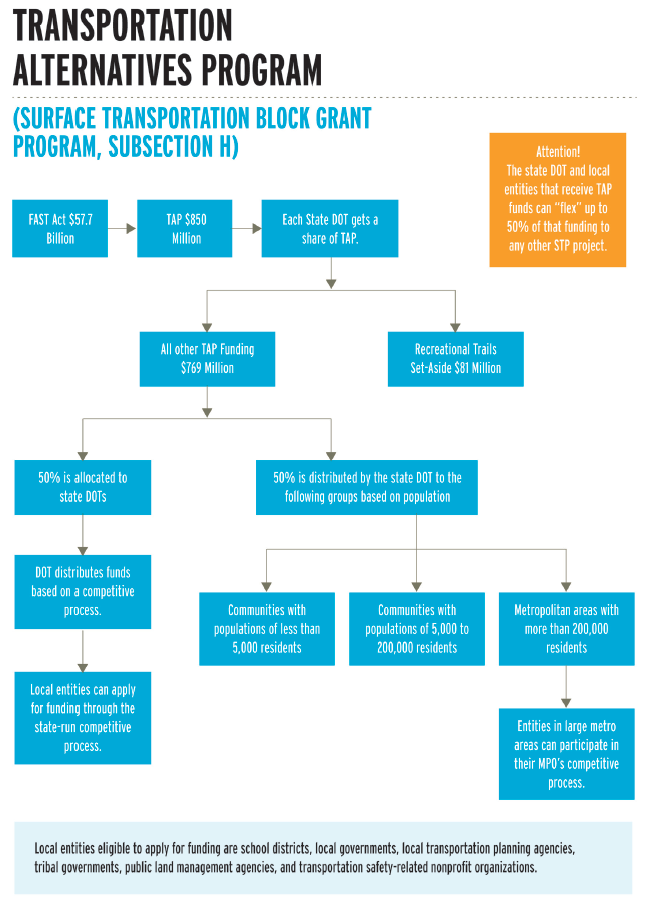
Under the FAST Act, Congress changed the Transportation Alternatives Program (TAP) from a stand-alone program to a set-aside program within the Surface Transportation Block Grant Program (STBGP). The Federal Highway Administration and most state departments of transportation still refer to these funds as the transportation alternatives program (TAP), but some refer to it as the Transportation Alternatives Set-Aside (TASA). Eligible projects include:
- ON-ROAD AND OFF-ROAD TRAIL FACILITIES for pedestrians, bicyclists, and other non-motorized forms of transportation, including sidewalks, bicycle infrastructure, pedestrian and bicycle signals, traffic calming techniques, lighting and other safety-related infrastructure, and transportation projects to achieve compliance with the Americans with Disabilities Act
- INFRASTRUCTURE-RELATED projects and systems that will provide safe routes for non-drivers, including children, older adults, and individuals with disabilities to access daily needs
- CONVERSION AND USE OF ABANDONED RAILROAD CORRIDORS FOR TRAILS for pedestrians, bicyclists, or other non-motorized transportation users
- CONSTRUCTION OF TURNOUTS, overlooks, and viewing areas
- COMMUNITY improvement activities
- ENVIRONMENTAL mitigation activities
- THE RECREATIONAL TRAILS PROGRAM eligibilities defined under 23 U.S.C. 206 of Title 23
- SAFE ROUTES TO SCHOOL PROGRAM-ELIGIBLE projects and activities listed at section 1404(f) of SAFETEA-LU (the federal transportation bill was originally enacted in 2005), including infrastructure-related projects and non- infrastructure-related activities
- PLANNING, DESIGNING, OR CONSTRUCTING BOULEVARDS and other roadways largely in the right-of-way of former Interstate System routes or other divided highways
The Governance Model for Road Safety
In the United States, road safety is a shared responsibility for a handful of federal agencies organized under the U.S. DOT, but these are generally two types of agencies: 1) modal agencies that build things (i.e., FHWA and FTA) and 2) regulatory agencies that regulate vehicles and behaviors [i.e., the National Highway Traffic Safety Administration (NHTSA) and Federal Motor Carrier Safety Administration (FMCSA)]. This split in responsibilities can be extremely helpful but can also be challenging as agencies and reports may focus on their area of responsibility instead of a more comprehensive or complementary approaches to safety.
In the United States, looking at two agencies can help citizens understand the governance split between built environment and behavioral traffic safety: the FHWA and NHTSA.
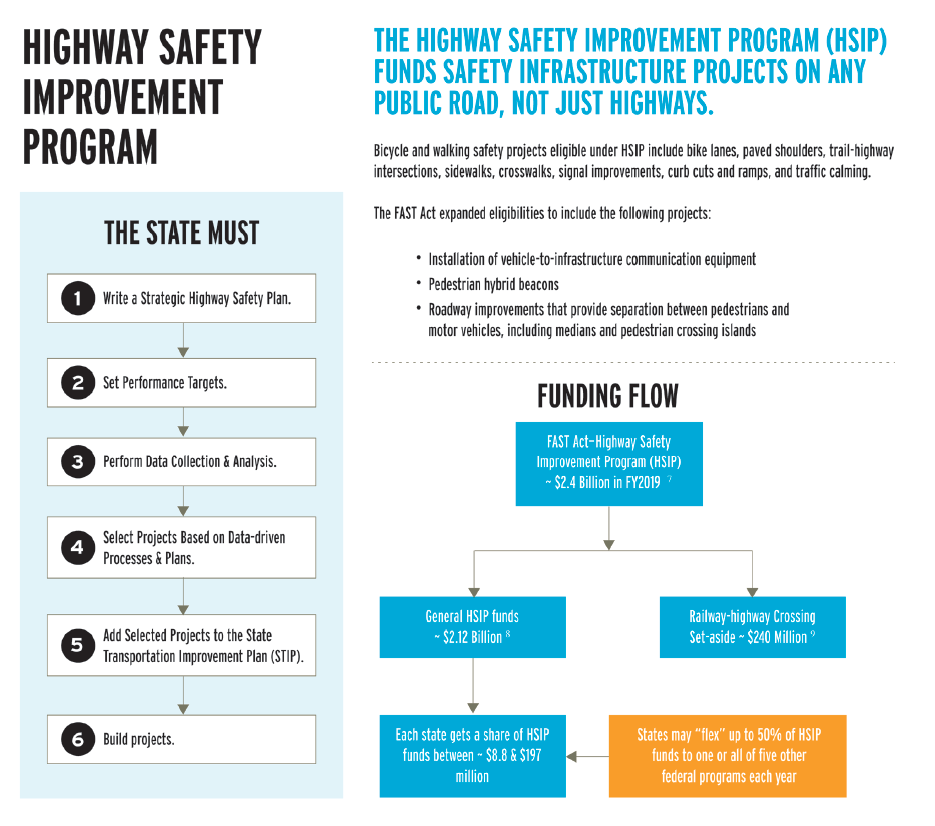
The Federal Highway Administration (FHWA) has a strategic goal to ensure the “nation’s highway system provides safe, reliable, effective, and sustainable mobility for all users.” This is accomplished through the work of the agency and its administration of congressionally authorized funding for roadways, most notably the Highway Safety Improvement Program (HSIP). To receive HSIP funding, each state must develop a State Strategic Highway Safety Plan (SHSP) that is based on safety data and developed by the state transportation department in consultation with at least 10 entities. The SHSP is then used to direct HSIP funding provided to each state (over $2 billion each year nationwide).
The National Highway Traffic Safety Administration’s (NHTSA) strategic plan states, “Safety is NHTSA’s top priority. We are the lead agency for traffic safety in the United States, with the mission to save lives, prevent injuries, and reduce economic costs due to roadway crashes through education, research, safety standards, and enforcement activities.” NHTSA defines the “Three Lanes on NHTSA’s Road to Zero” as 1) proactive vehicle safety, 2) advanced safety technology, and 3) human choices.
Notably missing is any reference to the built environment, which is outside of NHTSA’s legislative mandate. NHTSA does play a role in supporting built environment changes implemented by FHWA or local communities, but this is within the context of NHTSA’s behavioral safety role (e.g., bicyclist and pedestrian safety is discussed in NHTSA’s strategic plan under Strategic Goal 4: Human Choices – Objective 1: Promote Innovative Solutions for Behavior Safety—Strategy: Reduce Pedestrian and Bicyclist Fatalities).
Similar to FHWA, NHTSA accomplishes its goals through agency actions and by administering congressionally authorized funding. In NHTSA’s case, two programs support people who promote bicycling and walking: 1) the State and Community Highway Safety Grant Program, and 2) the National Priority Safety Program. These programs are commonly referred to by their sections in the United States Code (USC): sections 23 USC 402 and 23 USC 405, respectively.
The State and Community Highway Safety Grant (402) Program pre-dates the creation of NHTSA and is NHTSA’s primary funding program. To receive funding, states must develop and report on grant funding via a Highway Safety Plan (HSP) that uses data-driven performance measures. Until 2012, the HSP (NHTSA) and SHSP (FHWA) were not required to have similar goals or approaches. In 2012, Congress passed the Moving Ahead for Progress in the 21st Century Act (MAP-21), which required coordination of HSP and SHSP. The HSP developed by each state is used to direct 402 funds in each state (approximately $600 million per year nationwide).
Funds administered under the 402 program can be used on a wide variety of traffic safety activities, including programs to:
- Improve pedestrian and bicycle safety
- Reduce speeding
- Reduce drug- and alcohol-impaired driving
- Reduce crashes from unsafe driving behavior
- Improve enforcement of traffic safety laws
- Improve traffic records
- Support school-based driver’s education classes
Notably missing from those eligible activities is automated enforcement, which uses cameras, radars, and/or other sensors to issue citations for drivers who do not obey speed limits or red lights. Under the FAST Act, “No 402 funds can be spent on the implementation of automated enforcement programs.” However, in a recent report where the National Transportation Safety Board (NTSB) recommended automated speed enforcement, NTSB noted that the Governors Highway Safety Association (GHSA), International Association of Chiefs of Police, American Association of State Highway and Transportation Officials, and National Association of City Transportation Officials have all adopted positions supporting automated speed enforcement. The Centers for Disease Control and Prevention also highlights NHTSA and FHWA speed camera operational guides and notes the effectiveness of automated enforcement at reducing both speeding and crashes. Automated speed enforcement is likely to improve safety for people who bike and walk since they are more sensitive to changes in speed than persons in motor vehicles. You can find more information about state laws regarding automated enforcement at https://data.bikeleague.org/data/states-traffic-laws-training-for-pedestrian-bicyclist-safety/.
The National Priority Safety (405) Program provides grants for seven priority areas identified by Congress in the Fixing America’s Surface Transportation (FAST) Act. The FAST Act created 23 USC 405(h), the priority safety program for non-motorized safety. Through this program, states are eligible for 5% of Section 405 funds, and they received $13.9 million in Fiscal Year 2018. States are eligible if their annual combined pedestrian and bicyclist fatalities exceed 15% all traffic fatalities, and if states provide a 20% match for funds. In 2017, every state eligible applied for and received funding through the 405(h) program.
“[S]tates may use grant funds only for training law enforcement on state laws applicable to pedestrian and bicycle safety, enforcement mobilizations and campaigns designed to enforce those state laws, or public education and awareness programs designed to inform motorists, pedestrians, and bicyclists of those state laws.” For more information on eligibility and funding, please see https://data.bikeleague.org/explore-data-page/.
In 2017, the GHSA published “A Right to the Road: Understanding and Addressing Bicyclist Safety,” which provided examples of how state highway safety offices and others are addressing bicyclist safety using 402 and 405 funds. A similar report on pedestrian safety efforts, Everyone Walks: Understanding and Addressing Pedestrian Safety, was published in 2015.
The Governance Model for Building Bicycling & Walking Infrastructure
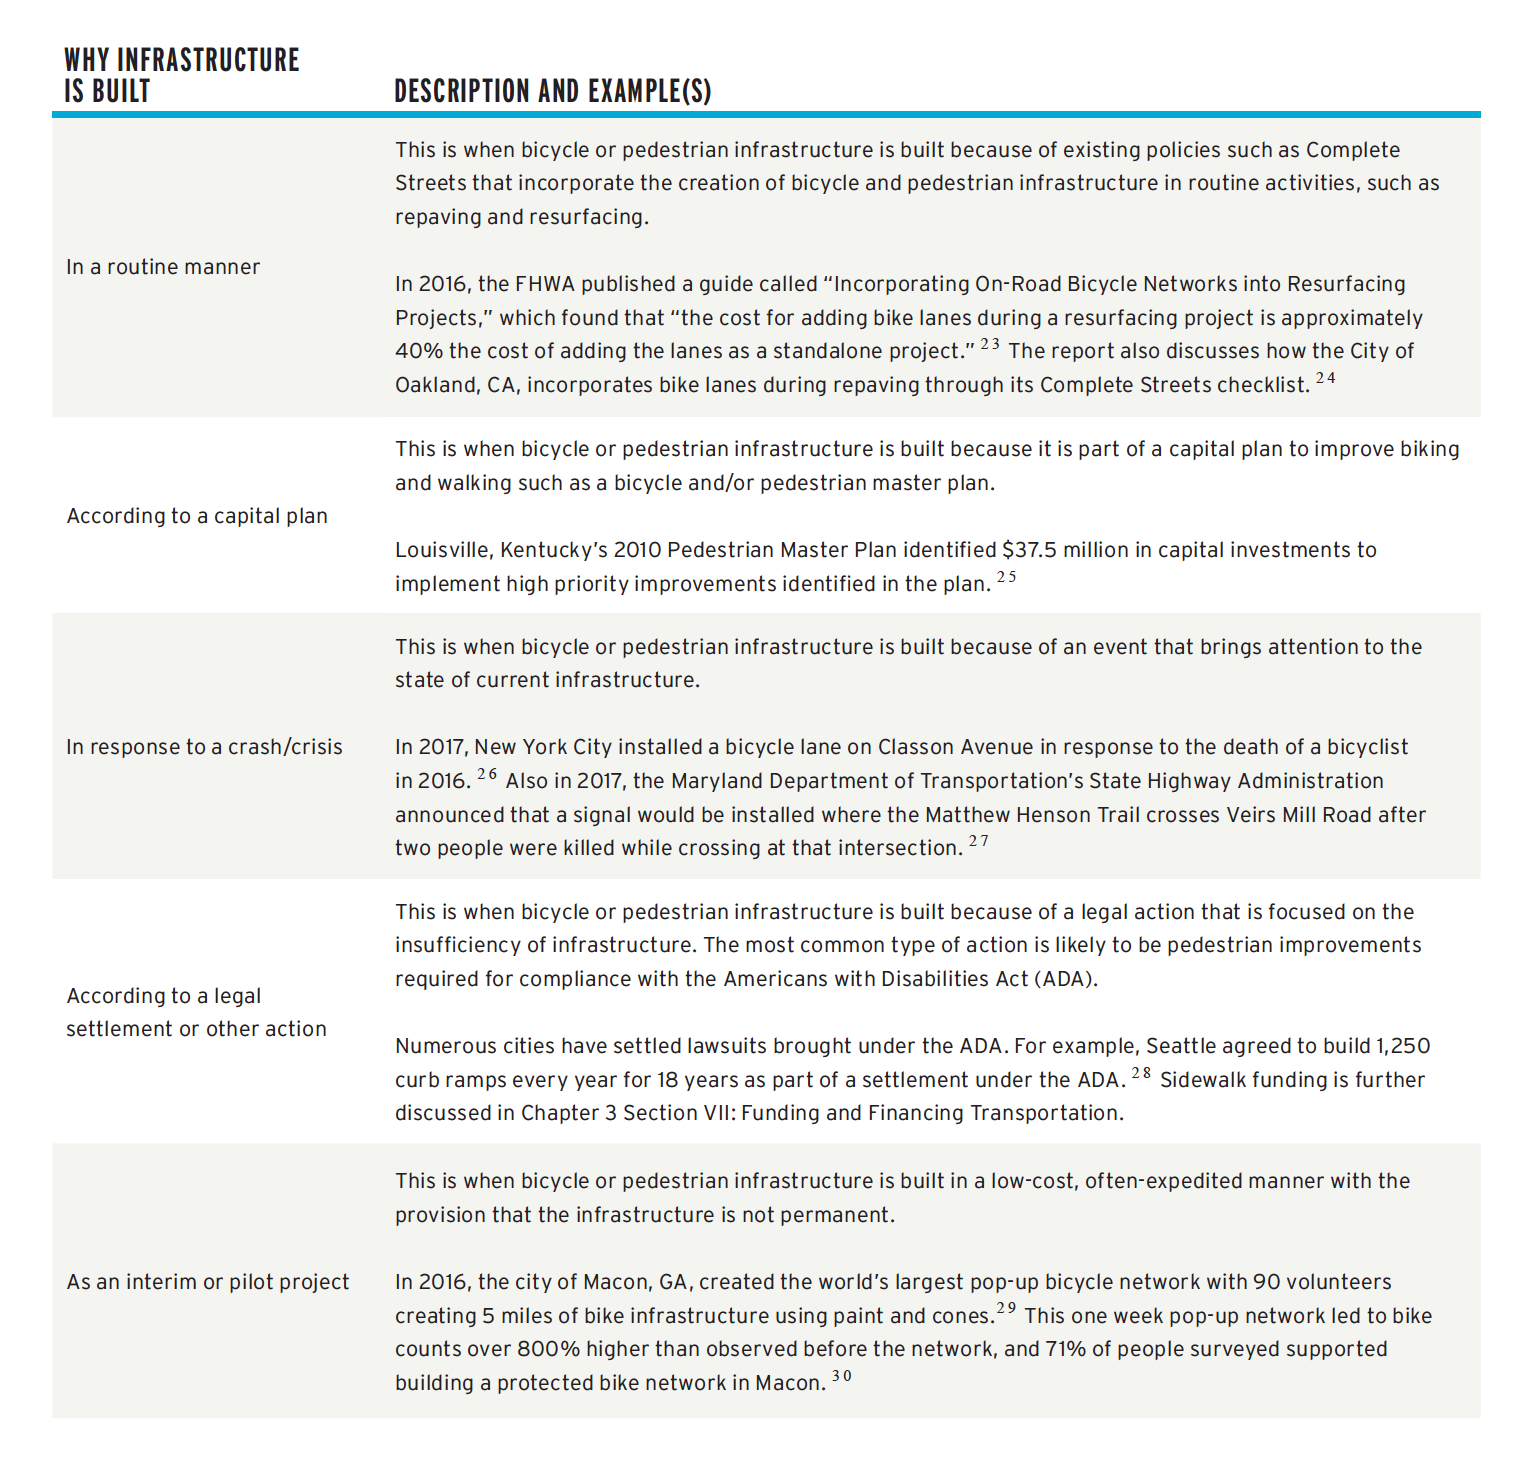
Bicycle and pedestrian infrastructure can be funded in a wide variety of ways. While funding can shape when and how projects are built, it can also distract from broader trends in how infrastructure is built. Below are some of the ways that communities and states are building biking and walking infrastructure, regardless of funding or financing sources.
EMBRACING EQUITY: ADDRESSING THE LEGACY OF ”URBAN RENEWAL”
In a previous era, the federal government spent over $425 billion to pave 48,000 miles of interstate highways based on a federal map that took them not just through rural areas between cities and states, but also directly through cities. “By the 1960s, federal highway construction was demolishing 37,000 urban housing units each year.”
Former U.S. DOT Secretary Anthony Foxx leaned into this issue with the Every Place Counts and Ladders of Opportunity initiatives and by publicly discussing “his case that bulldozing highways through where poor people lived was public policy in the mid-20th century.” Under the Ladders of Opportunity initiative, three principles for addressing the historic legacy of highway construction in urban areas were proposed:
- PRINCIPLE ONE: While transportation needs to connect people to opportunities, it may also “invigorate opportunities within communities.”
- PRINCIPLE TWO: Projects take into account communities that “have been on the wrong side of transportation decisions” and figure out ways to make them stronger.
- PRINCIPLE THREE: The projects could be built for and by the communities they go through. 34
These principles suggest the need for benchmarks identifying communities that have been on the wrong side of transportation decisions, quantifying opportunities within communities, and ensuring projects are built for and by affected communities. One potential benchmark, although not based on past transportation decisions, is the “opportunity zones” designation created in the 2017 Tax Cut and Jobs Act. The “opportunity zone” designation provides favorable tax treatment for private investments in low-income areas designated by states.
The institutional values or blind spots that led to the building of highways through disenfranchised communities are likely to continue to confront people who seek to improve biking and walking. As highways reach the end of their functional life and are maintained, expanded, or altered, and bicycle and pedestrian networks are built for the first time, it is important that transportation institutions realize the history that may contribute to mistrust of these investments and proactively work with communities affected by projects to mitigate and address their concerns.
ADVANCING UNDERSTANDING: EXPLICIT TRANSPORTATION HIERARCHIES
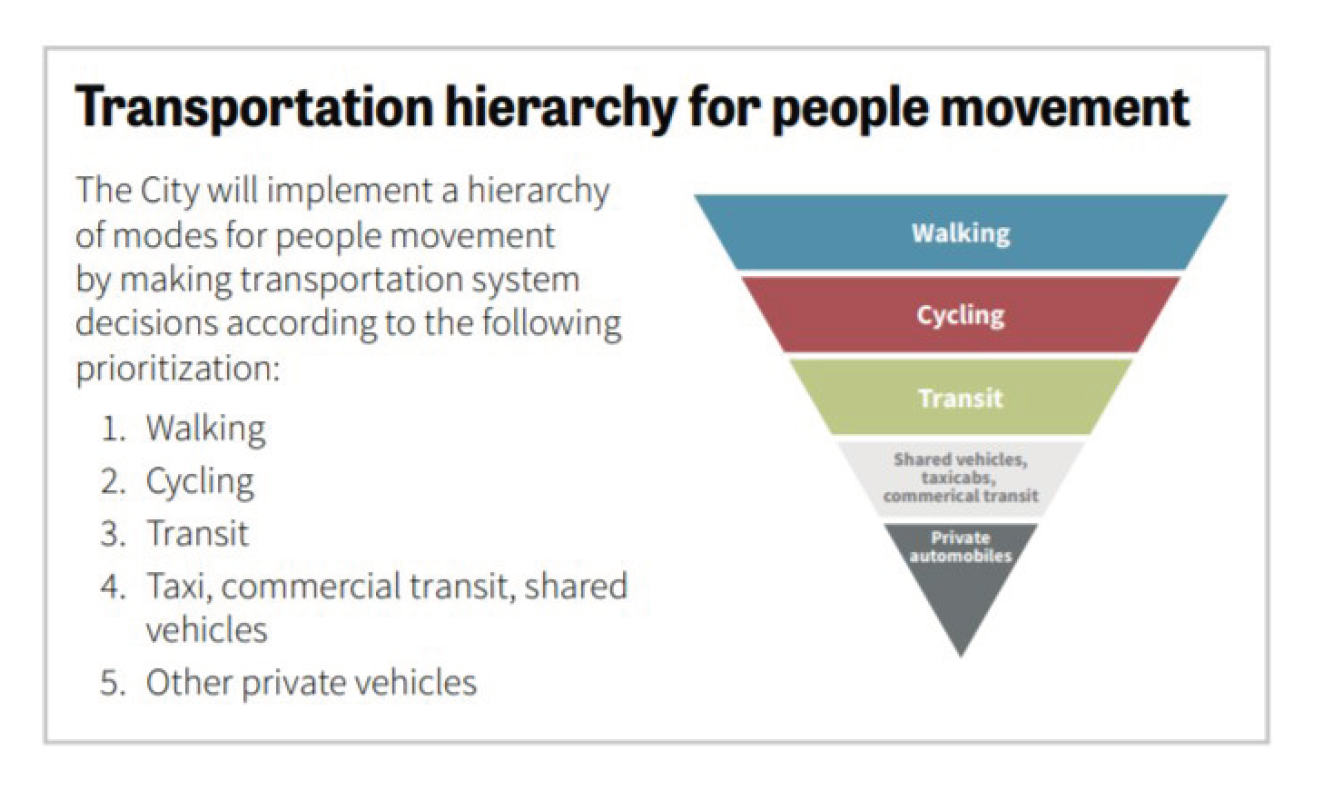
One way communities have begun to change the transportation context is by adopting a transportation hierarchy in their policies, giving a reference point for how they will plan and develop their transportation system.
In Portland, Oregon, this process led to adoption of a “sustainable transportation hierarchy” in its 2009 Climate Plan, which was reaffirmed in its 2015 Climate Plan. Portland’s transportation hierarchy is a statement from the city that it will include the movement of people by walking, cycling, transit, and shared vehicles before private automobiles. While the city’s hierarchy was adopted for environmental reasons, it also reflected the view that costs of various transportation modes such as walking, cycling, and transit are more affordable than transportation by private automobiles.
The formal adoption of an explicit transportation hierarchy in Portland appears to be somewhat unique and no comparative research of city or state hierarchies was found in the development of the 2018 Benchmarking Report.