IN THIS SECTION, THE BENCHMARKING REPORT EXPLORES THE EFFECTS OF TRAFFIC LAWS AND ENFORCEMENT ON BICYCLING AND WALKING. THESE INCLUDE RECENT DEVELOPMENTS OF TRAFFIC LAWS MEANT TO PROTECT PEOPLE WHO BIKE AND WALK, WAYS THAT SOME LAWS RESTRICT BIKING AND WALKING, AND ENFORCEMENT EFFORTS THAT HAVE IMPACTED PEOPLE WHO BIKE AND WALK.
Use this section to understand how bicycling and walking are affected by traffic laws and their enforcement.
Making the Case: Progress on Laws to Protect People Who Bike & Walk
- The Case for New Traffic Laws to Protect People Who Bike & Walk
- The Case for Freedom of Movement for People Who Bike & Walk
- The Case for Stricter Liability for Drivers
Advancing Understanding: Data on Behaviors in Bicyclist & Pedestrian Crashes
Embracing Equity: Reasons To Be Concerned about Enforcement-related Approaches to Traffic Safety
Making the Health Connection: Public Health Law Efforts To Promote Physical Activity
Introduction
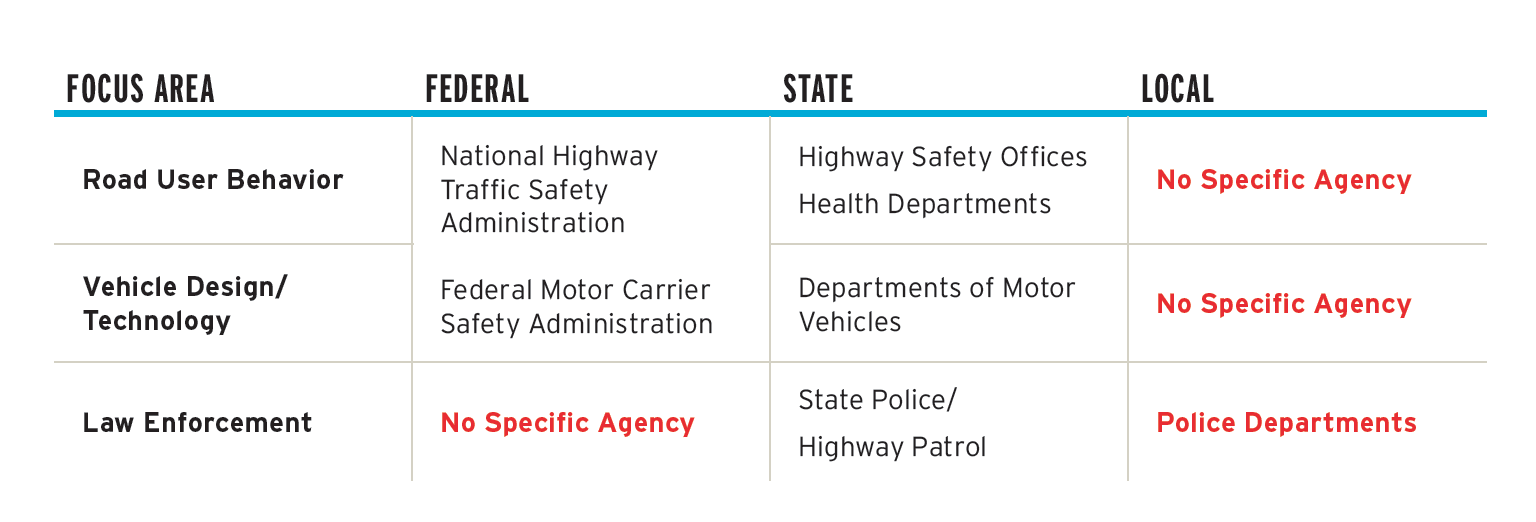
Road safety efforts are often organized around three types of action: 1) education, 2) enforcement, and 3) engineering. This section is concerned with the first two types of action and how they are governed at federal, state, and local levels. This topic is focused on the structures and roles of the stakeholder agencies that educate and execute enforcement of roadway laws, rather than funding issues. Compared to engineering, which is typically governed primarily by a transportation agency, a more diverse set of agencies is involved in governance for road safety education and enforcement.
Footnote 1
MAKING THE CASE: PROGRESS ON LAWS TO PROTECT PEOPLE WHO BIKE & WALK
The Benchmarking Report focuses on laws, rather than law enforcement. Laws are easier to find, assess, and change, and often that change is required before effective enforcement. The reality today is that many of our current laws do not provide protections for bicyclists and pedestrians and were sometimes instead written to restrict the movement of bicyclists and pedestrians. Today, automated enforcement is one example of an area that needs enabling legislation or is likely to be preempted by legislation. 2
| AUTOMATED ENFORCEMENT is one example of an area that needs enabling legislation or may be preempted by legislation. |
The Case for New Traffic Laws to Protect People Who Bike & Walk
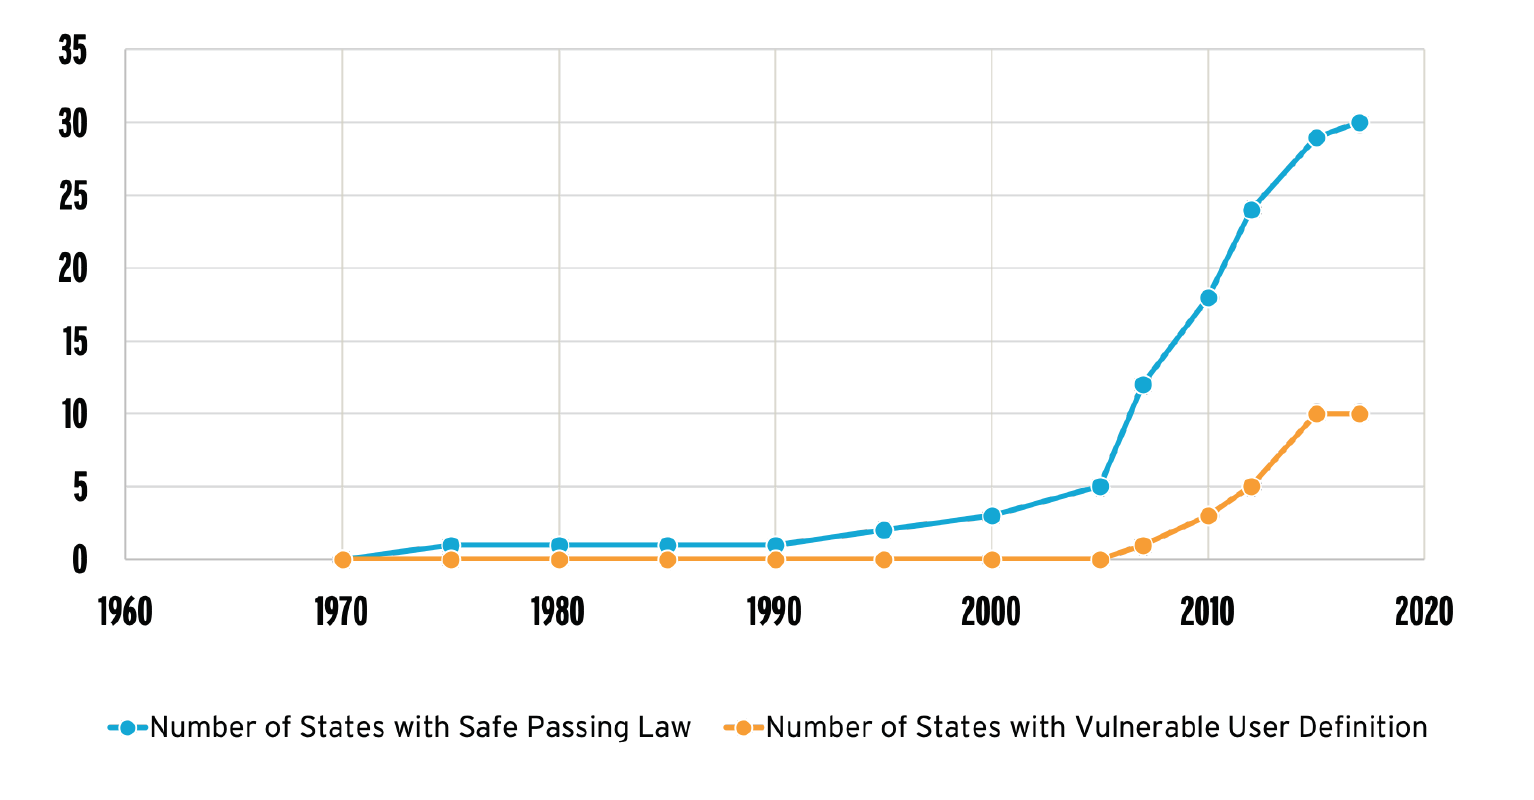
Over the last decade, there have been significant advancements in laws that protect people who bike and walk. Two of the most notable national changes are safe passing laws and vulnerable road user laws. At the local level, there have also been advancements in pedestrian-specific protections such as New York City’s Right of Way law, which “makes it a misdemeanor crime when a driver fails to yield and kills or injures a person walking in the crosswalk with the right of way.” 3 These laws are important because they are official reactions to the dangers presented to people who bike and walk and provide legal recourse for people who are injured or killed while biking or walking. This is in contrast to the early development of traffic laws that often sought to restrict people who bike and walk in order to enable the free flow of cars. 4
Safe passing laws are a reaction to the most common type of crash that leads to the death of a bicyclist—a motorist hitting a bicyclist from behind. The prevalence of this crash type is somewhat disputed, but federal data and other collected data both suggest that, although rare when considering all crashes involving bicyclists and motor vehicles, it is this type of crash that most often leads to the death a bicyclist. 5
“Every state has a variation of a safe passing law, with 36 states and DC explicitly addressing bicyclists. However, the actual distance—typically 3-feet—is defined by 28 states and DC, with Pennsylvania (4-feet) and South Dakota (3-feet on roads with a speed limit at or below 35 mph; 6-feet on roads with speed limits over 35 mph) mandating even greater minimum distances.” 6 The first safe passing law specifically aimed at protecting bicyclists by defining a safe distance was passed in Wisconsin in 1973. The law did not start to become widespread until the 2000s and has since become the rule in the majority of states. 7
Vulnerable road user laws can take many forms, but the League focuses on states with laws that provide a definition of who is a “vulnerable road user” (sometimes also defined as “vulnerable user” or “vulnerable highway user”). 8 A state can use its definition of who is vulnerable in multiple way: 9
1
CREATE A BASIS FOR PROSECUTORS TO SEEK HARSHER PENALTIES,
where a traffic violation that results in the serious injury or death of a vulnerable road user can result in greater penalties than the same violation that does not result in the serious injury or death of a vulnerable road user
2
IDENTIFY STATE ACTIONS THAT WILL BE TAKEN TO MAKE VULNERABLE ROAD USERS SAFER,
such as education programming, complete streets infrastructure creation, or other actions.
3
ADDRESS SPECIFIC CIRCUMSTANCES,
where existing statutes did not provide the same protection to vulnerable road users because they were written with the assumption that only drivers would be involved in those circumstances.
Every state that defines a “vulnerable road user” for any purpose includes people who bike and walk, and many also include a variety of other potential users, including:
- Users of wheelchairs
- Law enforcement and other emergency workers
- People on motorcycles
- People roller blading
- People driving farm tractors
- People herding animals
- People using an electric personal assistive mobility device
- Highway workers
The League of American Bicyclists’ Model Vulnerable Road User law provides 11 types of users. 10 Maine’s definition encompasses at least 13. 11
Both safe passing laws and vulnerable road user laws share similarities with move over laws created for law enforcement officers. Move-over laws generally provide that drivers should move into an adjacent lane when they are passing a law enforcement vehicle or other emergency vehicle displaying flashing lights on the side of the road. 12 Every state has enacted a move over law. 13
The Case for Freedom of Movement for People Who Bike & Walk
Streets are a public good, but since the early 1900s, many have been primarily designed for cars. Conscious efforts to restrict the movement of people who bike and walk were common in the past century, since they were seen as necessary to make streets available for the free movement of cars. 14 Over time, this has contributed to auto-dependency and an auto-centric operation and management of the public realm. This has generated a diversity of negative impacts, many of which particularly impact those who lack access to a private vehicle. As we approach an era of automated vehicles, society again has an opportunity to re-assess whether streets are operated as public goods for all people or primarily for the benefit of people with access to one type of technology.
In Bicycling and the Law, Bob Mionske provides common law and constitutional arguments for a right to travel that includes non-motorized travel. 15 The early development of traffic laws recognized the right to travel by a mode of a person’s choosing as stated by the Supreme Court of Kansas in 1890: “Each citizen has the absolute right to choose for himself the mode of conveyance he desires, whether it be by … car… or by bicycle … subject to the sole condition that he will observe all those requirements that are known as the ‘law of the road.’ The right of the people to the use of the public streets of a city is so well established and so universally recognized in this country that it has become a part of the alphabet of fundamental rights of the citizen.” 16
The intervening development of communities designed primarily for car-based travel has inspired some people to restate the right of choice in how a person travels. As an example, Nashville, Tennessee, adopted a nonbinding “Declaration of Transportation Independence” that states, in part, “Nashvillians should have the right to: Choose whether to drive, take public transportation, walk or bike for the majority of trips … Decide not to own a car, or to be forced to buy a second one … Decide not to use a car to make every trip because there is another option…” 17
The Case for Stricter Liability for Drivers
The first pedestrian death involving an automated vehicle provides insights into how the responsibility of people who bike and walk will continue to be a question when automated vehicles are deployed. On March 20, 2018, an Uber self-driving SUV struck and killed 49-year-old Elaine Herzberg while she walked her bicycle across a street in Tempe, Arizona, around 10 p.m. 18
Shortly after Herzberg’s death, the police chief of Tempe said, “The driver said it was like a flash—the person walked out in front of them … [It] appears that the Uber would likely not be at fault in this accident.” 19 This reaction has been seen previously for pedestrian deaths caused by motor vehicles. “In the aftermath of crashes between drivers and vulnerable road users, such as pedestrians and cyclists, there’s a tendency to blame the victim.” 20 The tendency of reporters to accept that crashes are inevitable accidents rather than something that can be prevented has led the Associated Press to update its stylebook in 2016 to recommend avoiding the word “accident” in cases where “negligence is claimed or proven.” 21
| “IN THE AFTERMATH OF CRASHES between drivers and vulnerable road users, such as pedestrians and cyclists, there’s a tendency to blame the victim.” |
The first death of a person who was hit by an automated vehicle has raised many questions about how liability could be assigned for this type of case. Is the AV operator responsible? Does a city bear a responsibility for its roadway design? Does a state bear responsibility for allowing AV operators to operate? 22
As liability is re-examined for automated vehicles, there may also be an opportunity to re-examine general driver liability in the United States. Current negligence liability puts people who bike and walk, or their surviving relatives, in a position of proving a driver’s negligence. 23 Generally, to prove negligence an injured person must show that there was a duty, a breach of that duty, that the breach caused an injury, and that there were damages from that injury. Traffic laws often establish duties and define how breaches might occur. For instance, a safe passing law that defines a safe passing distance of 3 feet or more establishes a duty of safe passing and a standard for its breach.
In most countries, civil liability for injuries to people biking and walking follow a different pattern than the one described above. In most countries, when a driver hits a person biking or walking a duty of care to people biking and walking and that a breach of that duty caused the collision is presumed, and the driver must show that they did not breach their duty in order to avoid liability. This liability framework is often referred to as presumed liability, strict liability or reverse onus. 24 A bicycle advocacy group in the United Kingdom found that only five countries in Europe did not use some form of presumed or strict liability. 25
By shifting the burden to drivers, these laws recognize the multiple ways that injured bicyclists and pedestrians are disadvantaged relative to a driver after a crash, including being injured or unconscious at the time of the crash, lacking sensor data or other data from vehicle systems, and possibly lacking insurance that will pay for legal representation. The shift in burden also recognizes that drivers have more power to avoid harm to a person biking or walking. 26 Automated vehicles will likely only reinforce these disparities in power and ability to provide evidence in the aftermath of a crash.
ADVANCING UNDERSTANDING: DATA ON BEHAVIORS IN BICYCLIST & PEDESTRIAN CRASHES
Law enforcement plays an essential role in the development of data about crashes, through completing crash reports when they arrive on the scene. Crash reports directly lead to what is reported by the National Highway Traffic Safety Administration (NHTSA) in resources such as the Fatality Analysis Reporting System (FARS) and are a critical input in the data-driven process of law enforcement and traffic safety. The NHTSA Fatality Analysis Reporting System (FARS) recently added bicyclist and pedestrian crash typing to its data system, so those crash types can be searched. This was initially attempted in 2012, but that data were withdrawn. Data are now available for 2014, 2015, and 2016.
Existing data on bicyclist and pedestrian crashes are limited, although data availability shows signs of potentially improving. NHTSA has a framework for improving crash data reporting through improved crash reports called the Model Minimum Uniform Crash Criteria (MMUCC). This effort began as a voluntary guideline in 1998, and its 5th edition was published in 2017. 27 The MMUCC is updated every five years, with the next update scheduled for 2022.
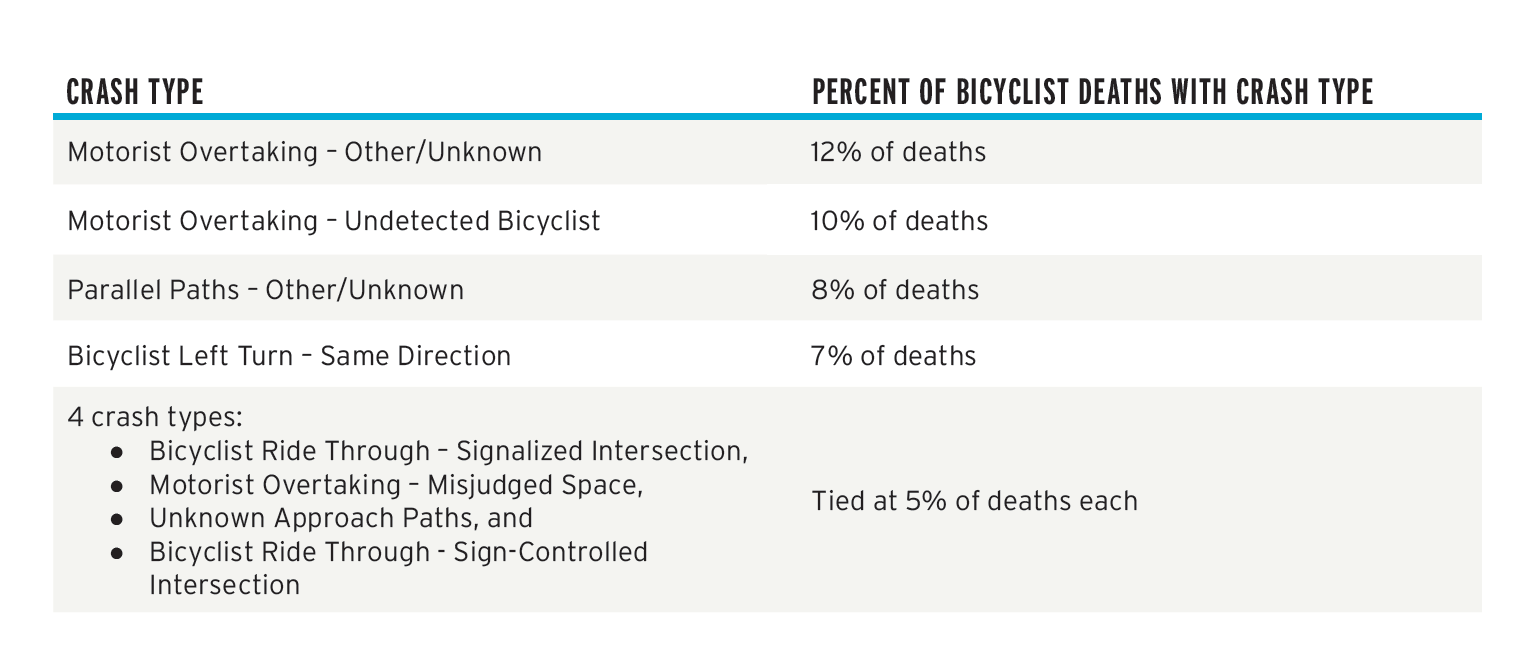
For bicyclist deaths, the crash types used in 2014-16 included 71 crash types with 30 identifying bicyclist actions, 26 identifying motorist actions, and the remaining 15 not identifying a responsible party. The five most common crash types that killed bicyclists between 2014 and 2016, which accounted for 56% of bicyclist deaths due to motor vehicles, can be found in the following figure:
An analysis of 51 state crash report templates and the MMUCC template in 2014 found that the only consistently included data fields related to bicycling were to indicate that a person was a “pedalcyclist” and whether or not they wore a helmet. 28
For pedestrian deaths, the crash types used in 2014-16 included 54 crash types with three identifying pedestrian actions, 10 identifying motorist actions, and the remaining 41 not identifying a responsible party, although some identified actions that did not name a party strongly imply a responsible party (such as five crash types based on some derivative of “standing/ walking/running along roadway”). The five most common crash types that killed pedestrians in 2014-2016, which accounted for 57.5% of pedestrian deaths due to motor vehicles, can be found in the following figure:
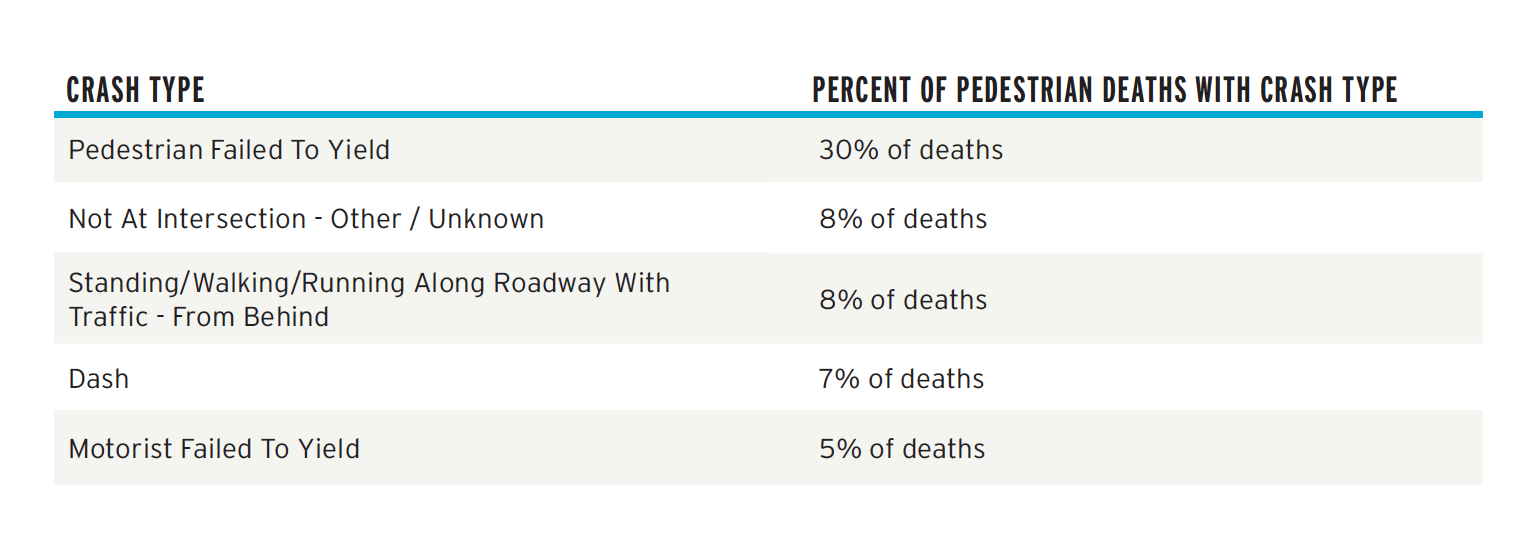
Of the pedestrian fatalities coded with the crash type of “pedestrian failed to yield,” approximately 18% of those pedestrians (885 of the 4,926 “pedestrian failed to yield” deaths reported in 2014-2016) were in a crosswalk when they “failed to yield.” This data is based upon police reports and, depending upon state definitions and training, may include marked and unmarked crosswalks. See Chapter IV: Show Your Data II: States for more information on state laws about drivers stopping or yielding at crosswalks.
While it is great to have better quality data on the crash types that kill bicyclists and pedestrians, the crash type descriptions most commonly associated with bicyclist and pedestrian deaths tend to be vague, including descriptors such as “Other/ Unknown.” Continued development of this type of data may help better inform street designs, enforcement actions, and other interventions related to bicyclist and pedestrian safety.
EMBRACING EQUITY: REASONS TO BE CONCERNED ABOUT ENFORCEMENT- RELATED APPROACHES TO TRAFFIC SAFETY
National data on law enforcement of all types appears to be less developed than transportation sector data. In recent years, much attention has been paid to the lack of data on the use of force by law enforcement. 29 Black Lives Matter organizations have made strong demands for better, more accountable policing 30 that could lead to improved data systems useful for a variety of purposes, including improving understanding of the relationship between traffic policing and traffic safety.
Data on enforcement actions is not currently mentioned as a dataset in a recent FHWA Guide for State DOT Safety Data Business Planning. 31 Organizations involved in the Black Lives Matter movement and other police transparency movements have raised important issues related to police accountability and have created language for further engaging with law enforcement to create more transparency in policing. 32 Examples of initiatives to promote more open data on policing include Open Data Policing, 33 the Stanford Open Policing Project, 34 the Police Data Initiative, 35 the Police Open Data Census, 36 and city open-data efforts such as the data portal on police stops by the City of Berkeley, California. 37
Several recent examples of law enforcement agencies pursuing enforcement strategies against people who bike and walk appear to be unrelated to stated goals for transportation safety.
Racial Differences in Enforcement While Bicycling in Tampa, Florida
A 2015 report by the Tampa Bay Times that reviewed 12 years of civil traffic citations in Hillsborough County, Florida, found that Tampa police wrote more than 10,000 bicycle-related tickets between 2003 and 2015. 38 Of those tickets, 79% were issued to Blacks while Blacks made up only 26% of Tampa’s population. 39
The reporting led to a federal investigation of the Tampa Police Department’s practices by U.S. Department of Justice’s Community Oriented Policing Services (COPS). COPS concluded that, despite the racial disparities in enforcement, which could not be explained by differences in bicycle ridership or manner of bicycle riding, no evidence of discriminatory intent was found in the enforcement. 40 Rather than racial discrimination, the COPS report concluded that racial disparities in enforcement were due to place-based differences in enforcement in higher crime areas. 41 The COPS report also concluded that the enforcement data did “not appear consistent with the agency having a strategic focus on bicycle safety” and that a reduction in bicycle citations after reporting on the racial disparities in bicycle tickets “had no discernible effect on the number of bicycle crashes with injuries, the number of stolen bicycles, or the number of Part I crimes generally.” 42
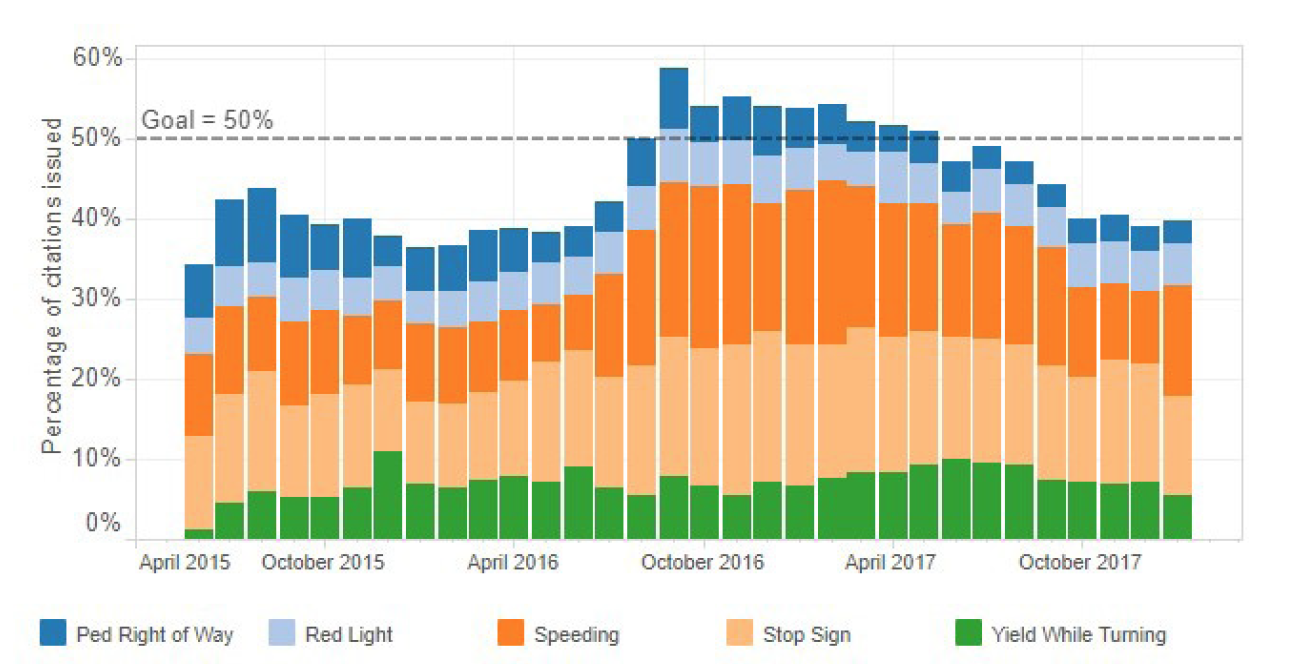
Unintended Consequences of Data-driven Enforcement in San Francisco
Recent enforcement efforts in San Francisco highlight the difficulty of data-driven enforcement being equally applied to all road users. As part of its Vision Zero goal adopted in 2014, 43 San Francisco committed to “Focus on the Five, meaning its police department set a goal to issue half of traffic citations to the five most common causes of collisions and injuries. In San Francisco, those five causes, as identified by an analysis of San Francisco Police Department (SFPD) collision data by the San Francisco Municipal Transit Agency in 2012, 44 are:
- Drivers speeding
- Drivers violating pedestrian right of way in a crosswalk
- Drivers running red lights
- Drivers running stop signs
- Drivers failing to yield while turning
| SEVERAL RECENT EXAMPLES OF LAW ENFORCEMENT AGENCIES pursuing enforcement strategies against people who bike and walk appear to be unrelated to stated goals for transportation safety. |
Footnote 45
In 2015, this data-driven enforcement approach butted up against bicyclists not making full stops along a popular bicycle route called the Wiggle. While each of the Focus on the Five violations were identified to be driver violations, the police captain with jurisdiction over the Wiggle responded to community complaints and applied “Focus on the Five” to issue citations for running stop signs to bicyclists. 46
The application of “Focus on the Five” to bicyclists, rather than drivers whose violations were responsible for most collisions and injuries, caused a backlash and calls for changes to traffic laws. The SFPD devoted 114 enforcement hours to a two-day enforcement effort to issue citations for running stop signs to bicyclists along the Wiggle. 47 The bicycle community responded with a protest, whereby bicyclists followed the law scrupulously, with every bicyclist stopping and putting a foot down, 48 and calling for enacting a local version of the “Idaho Stop” that allows bicyclists to treat stop signs as yield signs. 49 , 50 In 2016, the San Francisco Board of Supervisors passed a policy to deprioritize ticketing bicyclists that roll through stop signs, but that policy was vetoed by the mayor. 51 In 2017, an effort to change the law was introduced in the California legislature but failed in committee. 52 Also in 2017, Delaware became the second state in the country to allow bicyclists to treat stop signs as yield signs when it enacted the Bicycle Friendly Delaware Act. 53 As cities and states pursue data-driven approaches to enforcement this experience highlights the need for being specific about how data drives interventions and considering data-driven policy changes that complement enforcement efforts.
MAKING THE HEALTH CONNECTION: PUBLIC HEALTH LAW EFFORTS TO PROMOTE PHYSICAL ACTIVITY
While the discussion in this section primarily with traffic laws, public health law professionals have often prioritized other legal issues that surround physical activity. Most notably, public health law leaders have promoted shared recreational use of public properties such as schools during non-school hours. 54 Shared-use agreements are primarily intended to address liability concerns of public school officials, so they can confidently open their facilities to the public for recreational use. 55 Shared-use agreement language often focuses on staffing responsibilities and the enforceability of the agreement and potential remedies, which further emphasizes that their purpose is to allay liability fears. 56
Evidence is limited regarding the effectiveness of shared-use agreements leading to increased physical activity, but what does exist is positive. 57 Shared-use agreements provide increased access to places that can provide physical activity at a low cost because these places already exist in most communities but are underused.
Adapted from Federal Highway Administration. Road Safety Fundamentals: Concepts, Strategies, and Practices that Reduce Fatalities and Injuries on the Road. Unit 5: Implementing Road Safety Efforts at Table 5-1. Available at https://rspcb.safety.fhwa.dot.gov/RSF/Unit5.aspx.
Pedestrian and Bicycle Information Center. Research Brief: An Overview of Automated Enforcement Systems and Their Potential for Improving Pedestrian and Bicyclist Safety (last updated December 2017). Available at http://www.pedbikeinfo.org/pdf/PBIC_Brief_AutomatedEnforcement.pdf.
Transportation Alternatives. The New York City Right of Way Law. Available at https://transalt.org/issues/vision-zero/right-of-way.
J. Stromberg. Vox. The Forgotten History of How Automakers Invested the Crime of “Jaywalking” (November 4, 2015). Available at https://www.vox. com/2015/1/15/7551873/jaywalking-history. See also K. McLeod. 42 Fordham Urban Law Journal 869 (2015). Bicycle Laws in the United States-Past, Present, and Future. Available at https://ir.lawnet.fordham.edu/ulj/vol42/iss4/2.
The League of American Bicyclists; Every Bicyclist Counts. Bicyclist Safety Must Be a Priority: Findings from a Year of Fatality Tracking—and the Urgent Need for Better Data (May 2014). Available at http://bikeleague.org/sites/default/files/EBC_report_final.pdf. (Finding that 40% of advocate- collected bicyclist deaths were attributable to a hit from behind, while 27% of deaths reported by FARS in 2010 using PBCAT crash typing were attributable to a hit from behind.).
Governors Highway Safety Association. A Right to the Road: Understanding and Addressing Bicyclist Safety (September 2017) at pp. 38-39. Available at https://www.ghsa.org/sites/default/files/2017-09/2017BicyclistSafetyReport-FINAL.pdf.
The League of American Bicyclists. Safe Passing Laws. Available at https://bikeleague.org/sites/default/files/Safe_Passing_Laws_07_2018.pdf.
The League of American Bicyclists. Model Vulnerable Road User Law. Available at https://bikeleague.org/content/model-vulnerable-road-user-law.
The League of American Bicyclists Bike Law University. Available at https://bikeleague.org/content/bike-law-university. See also League of American Bicyclists. Vulnerable Road User Laws. Available at https://bikeleague.org/sites/default/files/VulnerableRoadUser_8_2018.pdf.
The League of American Bicyclists. Model Vulnerable Road User Law. Available at https://bikeleague.org/content/model-vulnerable-road-user-law.
Maine Revised Statutes. Title 29-A: MOTOR VEHICLES AND TRAFFIC §101. Definitions 91-A Vulnerable User. Available at http://legislature. maine.gov/statutes/29-A/title29-Asec101.html.
AAA. Digest of Motor Laws. Available at http://drivinglaws.aaa.com/tag/move-over-law.
National Safety Commission. Move Over, America campaign. Available at http://www.moveoveramerica.com.
See Peter Norton. Technology and Culture. Street Rivals: Jaywalking and the Invention of the Motor Age Street (April 2007). Available at https:// researchgate.net/publication/236825193_Street_Rivals_Jaywalking_and_the_Invention_of_the_Motor_Age_Street (detailing the development of jaywalking laws in Los Angeles and the spread of such laws throughout the United States).
Bob Mionske, Steven Magas, and Rick Bernadi. Bicycling and the Law at pp. 1-13 (2007).
Bob Mionske, Steven Magas, and Rick Bernadi. Bicycling and the Law at p. 12 (2007), quoting Swift City of Topeka, Supreme Court of Kansas (1890).
J. Garrison. Tennessean (USA Today Network). Mayor Briley Signs “Declaration of Transportation independence” for Nashville (April 2, 2018). Available at https://www.tennessean.com/story/news/2018/04/02/nashville-transit-briley-declaration/479009002.
Troy Griggs and Daisuke Wakabayashi. New York Times (3/21/2018). How a Self-Driving Uber Killed a Pedestrian in Arizona. Available at https://nytimes.com/interactive/2018/03/20/us/self-driving-uber-pedestrian-killed.html.
Carolyn Said. San Francisco Chronicle (3/28/2018). Exclusive: Tempe police chief says early probe shows no fault by Uber. Available at https://sfchronicle.com/business/article/Exclusive-Tempe-police-chief-says-early-probe-12765481.php.
Meg Dalton. Columbia Journalism Review (4/4/2018). When covering car crashes, be careful not to blame the victim. Available at https://cjr.org/ analysis/when-covering-car-crashes-be-careful-not-to-blame-the-victim.php (citing Heather Magusin. Earth Common Journal (October 2017). If you want to get away with Murder, Use Your Car. Available at https://journals.macewan.ca/earthcommon/article/view/1229/1026).
Meg Dalton. Columbia Journalism Review (4/4/2018). When covering car crashes, be careful not to blame the victim. Available at https://cjr.org/ analysis/when-covering-car-crashes-be-careful-not-to-blame-the-victim.php (citing Heather Magusin. Earth Common Journal (October 2017). If you want to get away with Murder, Use Your Car. Available at https://journals.macewan.ca/earthcommon/article/view/1229/1026) (crediting the #CrashNotAccident campaign led by Transportation Alternatives, a pedestrian, bike, and public transit advocacy group based in New York City)..
Ian Bogost. The Atlantic (3/20/2018). Can You Sue a Robocar? Available at https://www.theatlantic.com/technology/archive/2018/03/can-you-sue-a-robocar/556007/.
Colleen Maker. Boston College Environmental Affairs Law Review (Volume 42, Issue 2, 2015). Strict Liability in Cycling Laws to Ready the Roads for Environmentally Friendly Commuting at Available at http://lawdigitalcommons.bc.edu/cgi/viewcontent.cgi?article=2176&context=ealr.
David Gardiner. Bicycle Accidents (July 13, 2016). Available at http://www.ottawalawyer.co/english/news/bicycle-accidents.htm.
Cycle Alert. Presumed Liability: The Facts (9/28/2015). Available at http://www.cyclealert.com/presumed-liability-the-facts/ (noting that “The UK and Ireland along with Romania, Cyprus and Malta are the only countries in Europe who are not managing civil claims for compensation following a road traffic collision between a motorist and cyclist or pedestrian under some form of presumed or strict liability legislation.”)
Colleen Maker. Boston College Environmental Affairs Law Review (Volume 42, Issue 2, 2015) at p. 497. Strict Liability in Cycling Laws to Ready the Roads for Environmentally Friendly Commuting at Available at http://lawdigitalcommons.bc.edu/cgi/viewcontent.cgi?article=2176&context=ealr.
National Highway Traffic Safety Administration. About MMUCC. Available at https://nhtsa.gov/mmucc.
Lusk, Anne C, Morteza Asgarzadeh, and Maryam S Injury Prevention (2015). Database improvements for motor vehicle/ bicycle crash analysis. Available at http://dx.doi.org/10.1136/injuryprev-2014-041317.
Kate Wheeling. Pacific Standard (10/10/2017). How Many People Are Really Killed by Police in the United States? Available at https://psmag.com/ social-justice/how-many-people-are-killed-by-police-in-the-united-states.
Campaign Zero. Solutions. Available at https://www.joincampaignzero.org/solutions/.
Federal Highway Administration. FHWA-SA-17-047. (July 2017). Guide for State Department of Transportation Safety Data Business Planning. Avail- able at https://safety.fhwa.dot.gov/rsdp/downloads/fhwasa17047.pdf.
Nazgol Ghandnoosh, Ph.D., Research The Sentencing Project (2015). Black Lives Matter: Eliminating Racial Inequity in the Criminal Justice System. Available at https://sentencingproject.org/wp-content/uploads/2015/11/Black-Lives-Matter.pdf (defining types of disparities in policing and four types of best practices for reducing disparities).
Southern Coalition for Social Justice. Open Data Policing. Available at https://opendatapolicing.com/.
Stanford Computational Journalism Lab and Stanford Computational Policy Lab. The Stanford Open Policing Project. Available at https:// openpolicing.stanford.edu/.
The Police Foundation. The Police Data Initiative. Available at https://policedatainitiative.org/.
Code for America. Police Open Data Census. Available at https://codeforamerica.github.io/PoliceOpenDataCensus/.
City of Berkeley Open Data. Berkeley PD – Stop Data. Available at https://data.cityofberkeley.info/Public-Safety/Berkeley-PD-Stop-Data/6e9j-pj9p.
Alexandra Zayas and Kameel Stanley. Tampa Bay Times. How riding your bike can land you in trouble with the cops – if you’re black. Available at http://www.tampabay.com/news/publicsafety/how-riding-your-bike-can-land-you-in-trouble-with-the-cops—if-youre-black/2225966.
Nusrat Choudhury, Deputy Director. American Civil Liberties Union Racial Justice Program (5/14/2015). If You’re Black or Brown and Ride a Bike in Tampa, Watch Out: Police Find that Suspicious. Available at https://wwaclu.org/blog/racial-justice/race-and-criminal-justice/if-youre-black-or- brown-and-ride-bike-tampa-watch-out
Greg Ridgeway, Ojmarrh Mitchell, Sheila Gunderman, Cedric Alexander, and James Letten. Office of Community Oriented Policing Services (2016). An Examination of Racial Disparities in Bicycle Stops and Citations Made by the Tampa Police Department: A Technical Assistance Report. Available at https://ric-zai-inc.com/Publications/cops-w0801-pub.pdf
Greg Ridgeway, Ojmarrh Mitchell, Sheila Gunderman, Cedric Alexander, and James Letten. Office of Community Oriented Policing Services (2016) at p. 3. An Examination of Racial Disparities in Bicycle Stops and Citations Made by the Tampa Police Department: A Technical Assistance Report. Available at https://ric-zai-inc.com/Publications/cops-w0801-pub.pdf
Greg Ridgeway, Ojmarrh Mitchell, Sheila Gunderman, Cedric Alexander, and James Letten. Office of Community Oriented Policing Services (2016) at pp. 4-5 and footnote 18 on p. 10. (Part I crimes include homicide, rape, aggravated assault, robbery, burglary, larceny theft, motor vehicle theft, and arson). An Examination of Racial Disparities in Bicycle Stops and Citations Made by the Tampa Police Department: A Technical Assistance Report. Available at https://ric-zai-inc.com/Publications/cops-w0801-pub.pdf
Vision Zero SF. Two-Year Action Strategy. Available at http://visionzerosf.org/about/two-year-action-strategy/.
City and County of San Francisco. City Performance Scorecards, Percentage of Citations for Top Five Causes of Collisions. Available at http://sfgov.org/ scorecards/percentage-citations-top-five-causes-collisions.
City and County of San Francisco. City Performance Scorecards, Percentage of Citations for Top Five Causes of Collisions. Available at http://sfgov.org/ scorecards/percentage-citations-top-five-causes-collisions.
Aaron Bialick. Streetsblog SF (7/24/2015). SFPD Captain Justifies Bike Crackdown By Misconstruing “Focus on the Five.” Available at https:// sf.streetsblog.org/2015/07/24/sfpd-captain-justifies-bike-crackdown-by-misconstruing-focus-on-the-five/.
Bryan Goebel. KQED News (1/20/2016). San Francisco’s Mayor Vetoes Rolling-Stop Policy for Bicyclists. Available at https://www.kqed.org/news/10839061/san-franciscos-mayor-vetoes-rolling-stop-policy-for-bicyclists.
Kevin Montgomery. San Francisco Weekly (7/30/2015). This is What Happened When Bicyclists Obeyed Traffic Laws Along the Wiggle Yesterday. Available at https://archives.sfweekly.com/thesnitch/2015/07/30/this-is-what-happened-when-bicyclists-obeyed-traffic-laws-along-the-wiggle-yesterday.
San Francisco Bicycle Coalition. Why We Support a Bike Yield Law for San Francisco (8/24/2015). Available at http://www.sfbike.org/news/why-we- support-a-bike-yield-law-for-san-francisco/.
Michael Cabanatuan and Kale Williams. San Francisco Gate (7/29/2015). F. bike riders’ Wiggle protest slows traffic. Available at https://www.sfgate. com/bayarea/article/S-F-bike-riders-Wiggle-protest-could-stop-6413072.php.
Bryan Goebel. KQED News (1/20/2016). San Francisco’s Mayor Vetoes Rolling-Stop Policy for Bicyclists. Available at https://www.kqed.org/news/10839061/san-franciscos-mayor-vetoes-rolling-stop-policy-for-bicyclists.
Eli Wirtschafter. KQED News (5/9/2017). Bill to Allow Cyclist to Roll Through Stop Signs Fails. Available at https://kqed.org/news/11447002/bill-to-allow-cyclists-to-roll-through-stop-signs-fails.
Bike Delaware. Bicycle Friendly Delaware Act. Available at http://www.bikede.org/bfda/.
Young, D. , Spengler, J. O., Frost, N., Evenson, K. R., Vincent, J. M., & Whitsel, L. (2014). Promoting physical activity through the shared use of school recreational spaces: a policy statement from the American Heart Association. American journal of public health, 104(9), 1583-8. Available at https:// www.ncbi.nlm.nih.gov/pmc/articles/PMC4151914/.
Public Health Law Center at William Mitchell College of Law. Eliminating Barriers for Community Recreational Use of School Property: Policy Guidance on Liability and Shared Use (2012). Available at http://www.publichealthlawcenter.org/sites/default/files/resources/phlc-fs-shareduse-samples- tatute-language-2012.pdf.
Benjamin Winig, and Tony Kuo. Californian Journal of Health Promotion (2017). A Public Health Law Analysis of Shared Use Agreements in Los Angeles County, 2010-2014. Available at http://www.cjhp.org/volume15Issue2_2017/documents/69-74_Kuo_CJHP2017_Issue2.pdf.
County Health Rankings & Roadmaps program of the Robert Wood Johnson Foundation and the University of Wisconsin Population Health Institute. Shared Use Agreements. Available at http://www.countyhealthrankings.org/take-action-to-improve-health/what-works-for-health/policies/ shared-use-agreements.