In this section, the Benchmarking Report discusses recent experiences with increased federal funding for biking and walking projects, state systems for financing and funding projects, local efforts to boost spending on biking and walking, and challenges to funding biking and walking projects.
Use this section to learn how bicycling and walking projects are funded and what debates exist about transportation funding mechanisms.
Making the Case: Moving Beyond the Benefits Principle to Improve System Performance
- The Case for Increased Funding for Bicycling & Walking
- The Case for Local Transportation Funding Measures
- The Case for Pricing Transportation Costs through Motor Vehicle-related Fees
Advancing Understanding: A Look at Sidewalk Funding
Embracing Equity: A look at User Fees in Transportation
Making the Health Connection: Health Impact Assessments Provide Insights on Project Outcomes
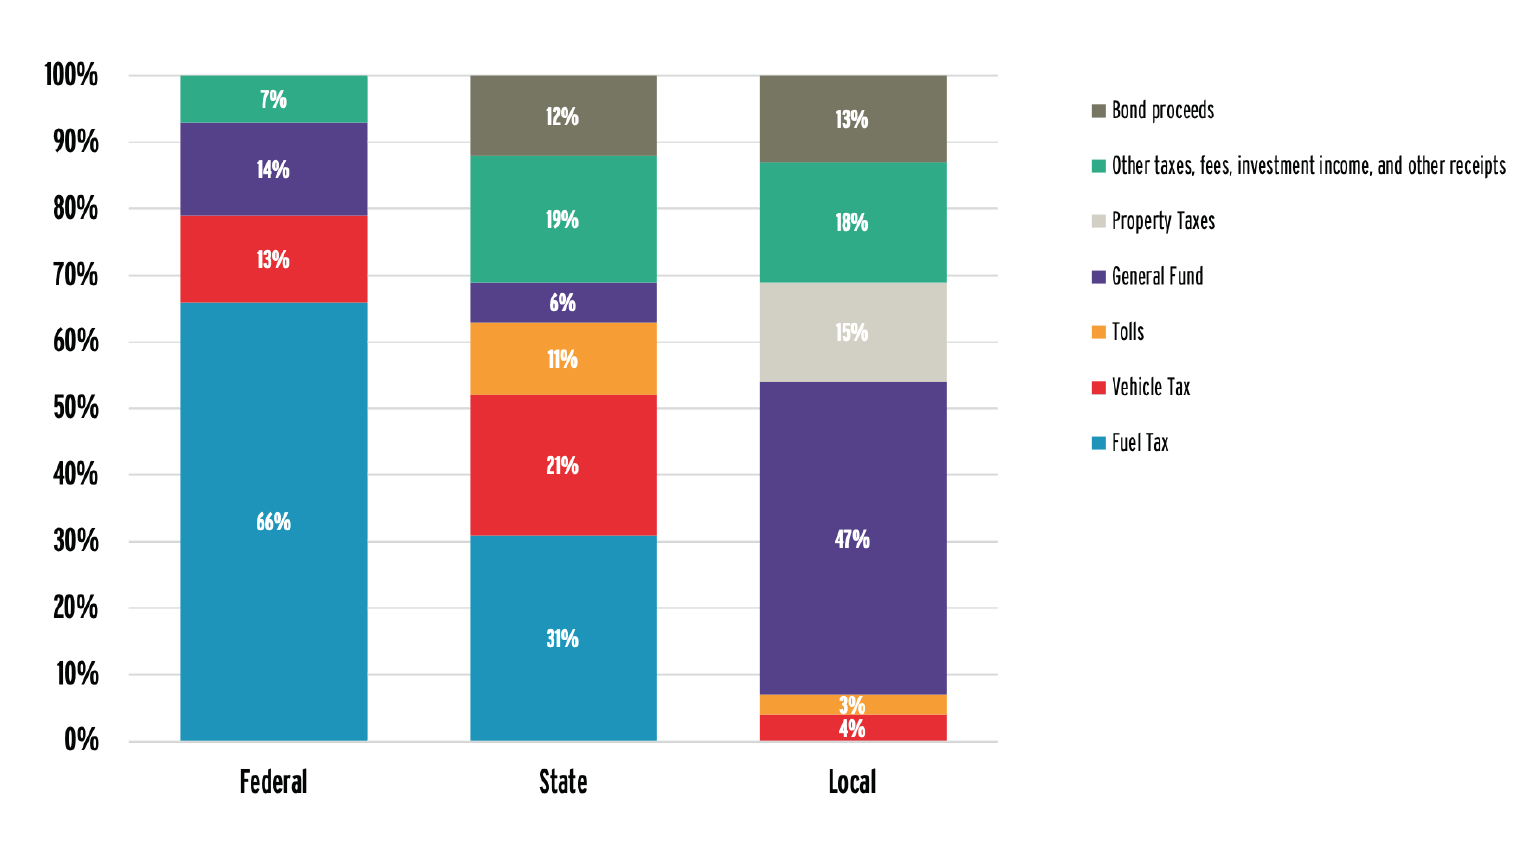
In the United States, the traditional basis for transportation funding is taxes on gasoline and diesel fuels. These taxes make up 66% of revenues for transportation at the federal level. 1 However, they comprise less than 30% of spending on transportation at all levels of government and have been declining as a share of revenues for transportation over time. 2 The declining value of gas taxes may be due to a variety of factors, including the increase of more fuel-efficient vehicles and the reduction of purchasing power of the federal gas tax due to inflation. The federal gas tax has not been raised since 1993 and has lost nearly 40% of its purchasing power due to inflation since its last increase. These factors are unlikely to reverse in the future and may become even more prominent.
MAKING THE CASE: MOVING BEYOND THE BENEFITS PRINCIPLE TO IMPROVE SYSTEM PERFORMANCE
The Case for Increased Funding for Bicycling & Walking
Bicycle and pedestrian federal spending data come from the Federal Highway Administration (FHWA)’s Fiscal Management Information System. The Benchmarking Report includes data on total obligations, per capita obligations, and the percentage of all obligated federal transportation funding spent on bicycle and pedestrian coded projects for each state. An obligation occurs when the FHWA approves a project and executes a project agreement, at that point “the Federal government [promises] to pay a State for the Federal share of a project’s eligible cost” 3 and that promise is called an obligation.
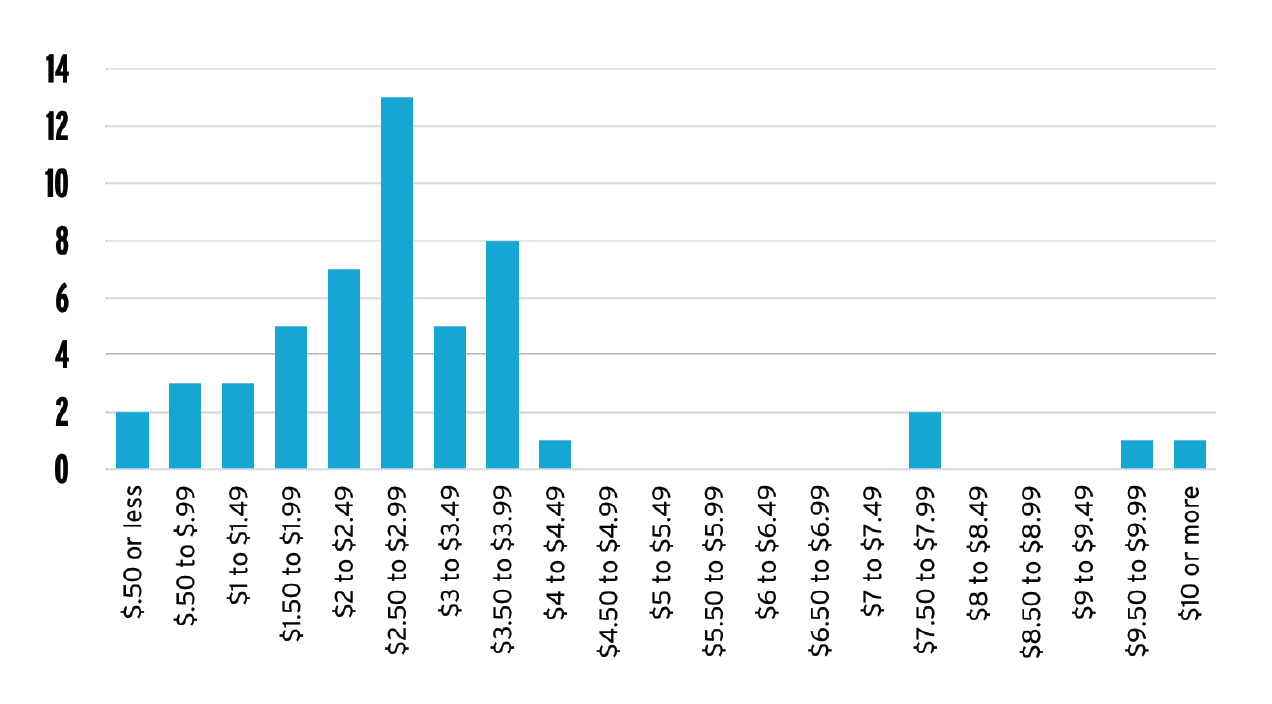
Overall, $3,797,229,085 in federal transportation funds were obligated to biking- and walking-coded projects between FY2012 and FY2016. This amount represents 1.9% of obligated federal transportation funding during that time period and a per capita funding level of $2.36 per person.
Most states spend between $1.50 and $3 per capita of their federal transportation funding on biking and walking projects. The four outlier states with per capita obligations over $7 per person – Alaska, Montana, Delaware, and Vermont – are also among the top 10 for all federal transportation spending per capita. This suggests that these outliers may reflect the way in which federal transportation funds are distributed in general rather than by state preferences for higher rates of investment in biking and walking projects. Although Delaware stands out for having a high rate of obligations to biking and walking projects by any measure.
The distribution in per capita funding levels can be seen in the chart below.
Footnote 4
It is difficult to draw conclusions about whether state use of federal transportation funding for biking and walking is increasing or decreasing. This is due to:
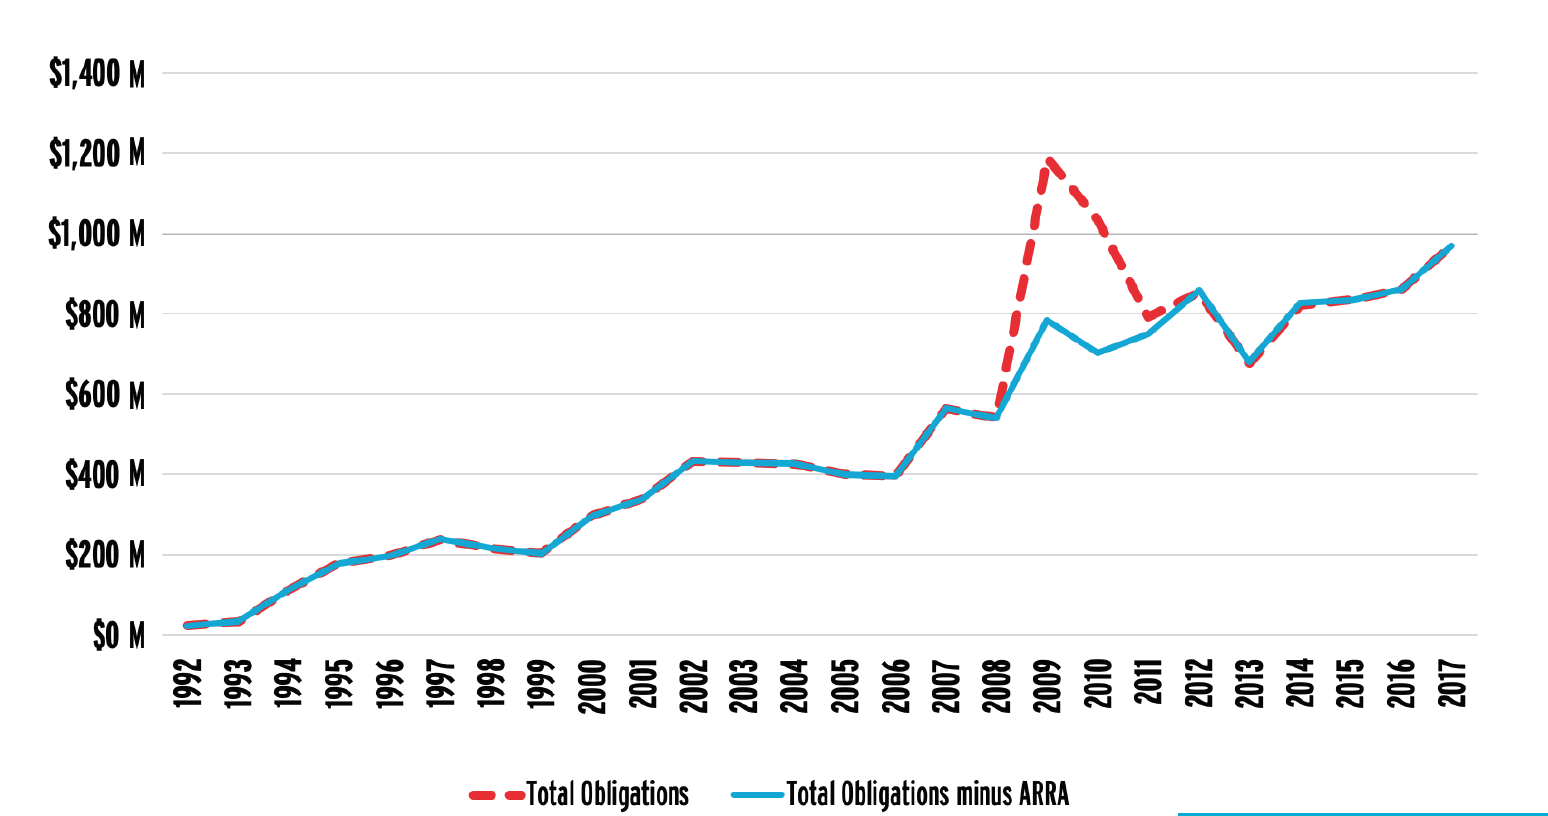
Funding changes for biking and walking projects due to ARRA can be seen in the graph below. Due to this shift in available federal transportation funding, states spent $25,821,237 less on biking and walking projects during FY2012-2016 compared to FY2007-2011.
Footnote 5
However, in the amount of federal transportation funding spent on biking and walking projects, evidence does point to increased state use of federal transportation funding for biking and walking. Examples include the following:
- Despite reduced available funds since the end of ARRA, 22 states spent more federal transportation funding on biking and walking projects in FY2012-2016 than during FY2007-2011.
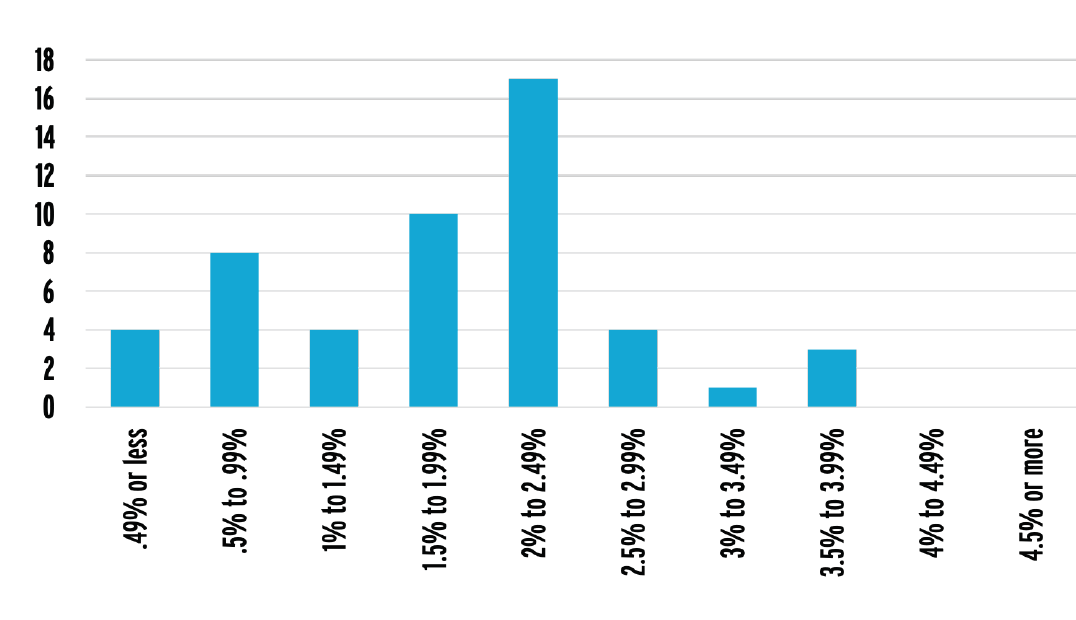
- The average percentage of federal transportation funding obligated to biking and walking coded projects increased from 1.8% for FY 2007-2011 to 2.1% for FY2012-2016.
- Twenty-eight states spent a larger percentage of their federal transportation funding on biking and walking projects in FY2012-2106 than in FY2007-2011; one spent the same percentage, and the remainder spent a smaller percentage.
The percentage of federal funding spent on biking and walking projects did not show any outlier states, despite the significant increases in the percentage of funding spent on biking and walking projects in some states. Distribution in percentage of funding levels can be seen in the graph below.
Footnote 6
Nationwide, the League of American Bicyclists’ analysis of FMIS data show that $2.36 of federal transportation funding per person is spent on bicycling and walking projects. FMIS data do not, and cannot, distinguish between spending on biking and walking. When asked to distribute $100 of taxes on transportation, American voters on average allocated $26.90 to expand and improve walking and biking paths and sidewalks—far higher than the 2% of federal funding spent on biking and walking , and the $2.36 per person spent on bicycling and walking. 7 For comparison, here are what some other countries spend per capita on bicycling:
- ENGLAND spends $5.28 per capita on bicycling. 8
- THE NETHERLANDS spends $29.48 per capita on bicycling. 9
- HUNGARY (whose GDP per capita is more than four times less than the United States) spends $4.45 per capita on bicycling. 10
Transportation funding in the United States does not depend only on federal spending. While state spending data on bicycling and walking projects are not readily available or provided in a uniform format like FHWA obligation data, several states have estimated the current bicycling and walking needs in their states.
In Colorado, a recent report by the Public Interest Research Group 11 recommended that Colorado invest:
- “$243.6 MILLION PER YEAR IN WALKING INFRASTRUCTURE to build 6,000 miles of missing sidewalks, repair 8,600 miles of inadequate sidewalks in Colorado’s urbanized areas and maintain the whole system.
- $229.5 MILLION PER YEAR TO BRING THE BIKING INFRASTRUCTURE in every city up to the standards of the best communities in Colorado, build regional bicycle routes that connect cities and towns across the state, ensure [its residents and visitors] have safe shoulders on rural roads to allow safe bike travel, and expand bike share programs to increase access to biking options.”
These investments would result in spending of $43.42 per capita for walking and $40.91 per capita for biking.
The 2008 Washington State Bike and Pedestrian Plan identified $1.6 billion in unfunded biking and walking projects from local Transportation Improvement Programs. 12 That plan contemplated investments over a 20-year time frame, meaning the identified need for biking and walking investments was $80 million per year or $10.80 per capita per year. In 2015, the Washington state legislature passed a 16-year funding bill that provides nearly $20 million per year for biking and Safe Routes to School projects, 13 and in 2018, an update to the state’s Bicycle and Pedestrian Plan was announced. 14
Increases in funding for biking and walking have been shown to lead to boosted rates of biking and walking, and improvements in bicyclist and pedestrian safety. In 2005, Congress authorized the Non-Motorized Transportation Pilot Project (NTPP), which provided $25 million for four communities in the United States (Columbia, Missouri; Marin County, California; Minneapolis area, Minnesota; and Sheboygan County, Wisconsin). The NTPP funds leveraged an additional $59 million in federal, state, and local funds (approximately $43 per capita annually over four years) leading to a variety of activities such as bicycle and pedestrian planning, infrastructure, and programming. The estimated outcomes of the NTPP were 22.8% and 48.3% increases in the number of pedestrian and bicycle trips across the four communities. 15 In addition, pedestrian injury rates declined between 17.9% and 55.1% in each of the four communities, and bicycling injury rates (incidents per number of trips) declined between 8.6% and 38.2% in each of the four communities. 16
The Case for Local Transportation Funding Measures
Bond measures at the local level have successfully provided funding streams for biking and walking projects.
» ALAMEDA COUNTY, CALIFORNIA
Voters passed Measure BB in 2014, 17 which is expected to provide $651 million for bicycle and pedestrian paths and safety between 2015 and 2045. 18
» ATLANTA, GEORGIA
Voters approved the Renew Atlanta bond program in 2015. 19 The Renew Atlanta bond program provided $250 million for road projects and has been credited with the City of Atlanta doubling its bike path mileage between 2012 and 2018. 20 Since approval of the Renew Atlanta bond program, the city hired its first “chief bicycle officer” 21 and issued its first annual report on bicycling. 22
» AUSTIN, TEXAS
Voters passed a Mobility Bond in 2016, providing $720 million that will be spent over eight years. 23 Bicycle and pedestrian projects are included in the Corridor and Local Mobility programs approved by the Bond, which make up roughly 86% of the Bond’s value. The $137 million dedicated to local mobility projects will be primarily delivered through the city’s Sidewalk Program, Active Transportation Program, Safe Routes to School, Transportation Safety Improvement Program, and Urban Trails 24 programs.
» DENVER, COLORADO
Measure 2A passed in 2017. 25 In this measure, “[m]ore than $70 million is designated to build missing segments of the sidewalk and bike networks, and $115 million overall is reserved for bike-ped projects across the city.” 26
» DALLAS, TEXAS
Voters approved a $533-million bond for roadwork that included funding for six major Complete Streets projects and a 50-mile shared use trail network called The Loop in 2017. 27 Of the total funding, $35.6 million is expected to be spent on trails, as well as to leverage an additional $50 million. 28 This influx of funding is significantly above the annual $500,000 that the City of Dallas has provided for biking improvements in the past. 29
However, not every county, city, or town has access to local revenue sources. Only 29 states allow local option sales taxes that can fund roads or general funds. Even fewer local jurisdictions can raise revenues through local option fuel taxes, with just 15 states allowing that option. 30 To learn more about state financing options for transportation, please see Chapter IV: Show Your Data II: States.
A recent Brookings Institution brief noted that localities are increasingly called on to contribute to transportation investments, but both federal and state governments restrict the ability of these localities to raise revenues, and federal funding programs often give states power over local transportation decisions. 31 Brookings makes several recommendations, saying, “States must be willing to let cities, counties, and regional governments experiment with different taxation schemes.” For the federal government, Brookings recommends prioritizing maintenance, especially in older, slower-growth places, and incentivizing states to remove preemption and allow different local taxation schemes.
The Case for Pricing Transportation Costs Through Motor Vehicle-Related Fees
The United States has a very low gas tax relative to other countries. The federal gas tax is 18.4 cents per gallon and has not been changed since 1993. State and local governments levy on average an additional 35 cents per gallon for a combined rate of 53 cents per gallon. The average gas tax in the 34 countries of the Organization for Economic Co-operation and Development is $2.62 per gallon, nearly five times the average gas tax in the United States. 32 Among OECD nations, the U.S. gas tax is second lowest (Mexico has no gas tax) and is less than half the gas tax in Canada, which is $1.25 per gallon.
The low gas tax in the United States results in two anomalies that are not fully appreciated or understood: First, current gas taxation rates do not fully fund road investments (gas taxes only pay for 30% of transportation funding at all levels of government) and, second, negative externalities (costs incurred by society due to motor vehicle use) are not included in the price of gasoline.
Common externalities of motor vehicle use include congestion, serious injuries and deaths due to motor vehicle-involved crashes, climate change, and pollution (which has health effects aside from climate change). 33 The International Monetary Fund’s report, “Getting Energy Prices Right,” 34 has attempted to quantify the costs imposed on society due to motor vehicle use for over 150 countries. For the United States, the IMF estimates motor vehicle use creates costs of $1.60 per gallon for gasoline and $2.10 per gallon for diesel, with 31 cents of this increase due to carbon dioxide emissions and 85 cents due to congestion. 35
Max Auffhammer and Michael Anderson at the University of California at Berkeley looked specifically at the costs imposed by crashes and found that those costs were equivalent to 97 cents per gallon. 36 They also found the average car on the road was 530 pounds heavier in 2008 compared to 1988, representing a 20% increase in weight; and that heavier vehicles weights significantly increased fatality rates. Auffhammer and Anderson estimated that an increase in the gas tax of 26 cents a gallon would internalize the increased probability of fatality from the increased fleet vehicle weight observed between 1988 and 2008.
Many policymakers question whether the gas tax will continue to be effective as motor vehicles become more fuel-efficient or electrically powered. While the gas tax may be the traditional method of making motor vehicles pay for their infrastructure and external costs, the future may include a variety of other fees, most prominently a vehicle-miles-traveled fee. Externalities may also be tackled by individual fees related to the individual externality. For example, the state of California has raised significant revenue for biking and walking, and other environmental mitigation through a carbon tax that applies to transportation fuels. 37
ADVANCING UNDERSTANDING: A LOOK AT SIDEWALK FUNDING
The Benchmarking Report primarily discusses funding for biking and walking projects through nationally available federal data on federal transportation funding. Due to the diversity of state and local government agency structures, legislative involvement in transportation funding, and diverse accounting systems, a similarly comprehensive discussion of biking and walking project funding by state and local government is difficult.
One example of the complexities that arise when attempting to quantify and track investments in bicycling and walking infrastructure can be found in the basic infrastructure for walking: sidewalks. A 2010 survey of 82 cities in 45 states found that 40% of cities require property owners to pay the full cost of repairing sidewalks; 46% share the cost with property owners; and 13% of cities pay the full cost of repairing sidewalks. 38 If these 82 cities are representative of most cities in the United States, then most cities are unlikely to have any record of what is spent on sidewalk maintenance because those costs are borne by property owners rather than the city.
Although many cities assign responsibility for sidewalk maintenance to property owners, the federal government, through the Americans with Disabilities Act (ADA), has created responsibilities for cities to provide and maintain sidewalks. Because of ADA, state and local governments have made many commitments 39 to repair and upgrade sidewalks, as an accessible system, including a $1.4 billion settlement by the City of Los Angeles. 40 While the U.S. Department of Justice Civil Rights Division provides information on 220 ADA settlements from all 50 states through Project Civic Access, it does not appear that an assessment of the total amount that cities and states have committed to ADA compliance, or how they are progressing on the sidewalk-related portions of those settlements, is currently available. 41
The scope of deficiencies in pedestrian infrastructure needs to be better understood. In 2018, a survey by the Oregon Department of Transportation done in response to an ADA lawsuit by Disability Rights Oregon found that “97% of 26,000 curb ramps inspected weren’t ADA-compliant, and 10 Oregon counties didn’t have a single compliant ramp.” 42 Without similar assessments of non-compliance and need, it will be difficult to understand the level of investment required to provide universal access for all people to biking and walking infrastructure and the progress made.
EMBRACING EQUITY: A LOOK AT USER FEES IN TRANSPORTATION
The gas tax has traditionally tied transportation funding and financing to the concept that transportation can be, is, and could be funded based on user fees. “The rationale for having user fees is the benefits principle,” says Matthew Gardner, executive director of the Institute on Taxation and Economic Policy. 43 The benefits principle is the idea that the person who benefits should pay. But, as Gardner explains, “that principle runs head on into the ability-to-pay principle. Low-income families don’t have the same ability to pay. The $20 you use to register your car is going to be a much bigger deal for a family below the poverty line.” 44
The user fee premise of transportation funding is often promoted by drivers, who pay the majority of user fees for transportation. Often discussions about transportation funding focus on who pays and should pay for transportation, rather than on the aims of transportation.
An example of this type of discussion can be seen in The Los Angeles Times article, “Bicyclists Shouldn’t Get a Free Ride When It Comes to Repairing Roads,” where an infrastructure lobbyist says, “A lot of them [bicyclists] think they’re basically on the side of angels … They think it’s OK just to rely on motorists for funding. I think everybody using the system ought to be paying into it.” 45 Missing from this argument is any discussion about the aims of transportation, consideration of issues like ability to pay, or recognition of the many sources of transportation funding that do not come from user fees, such as property taxes.
Footnote 46
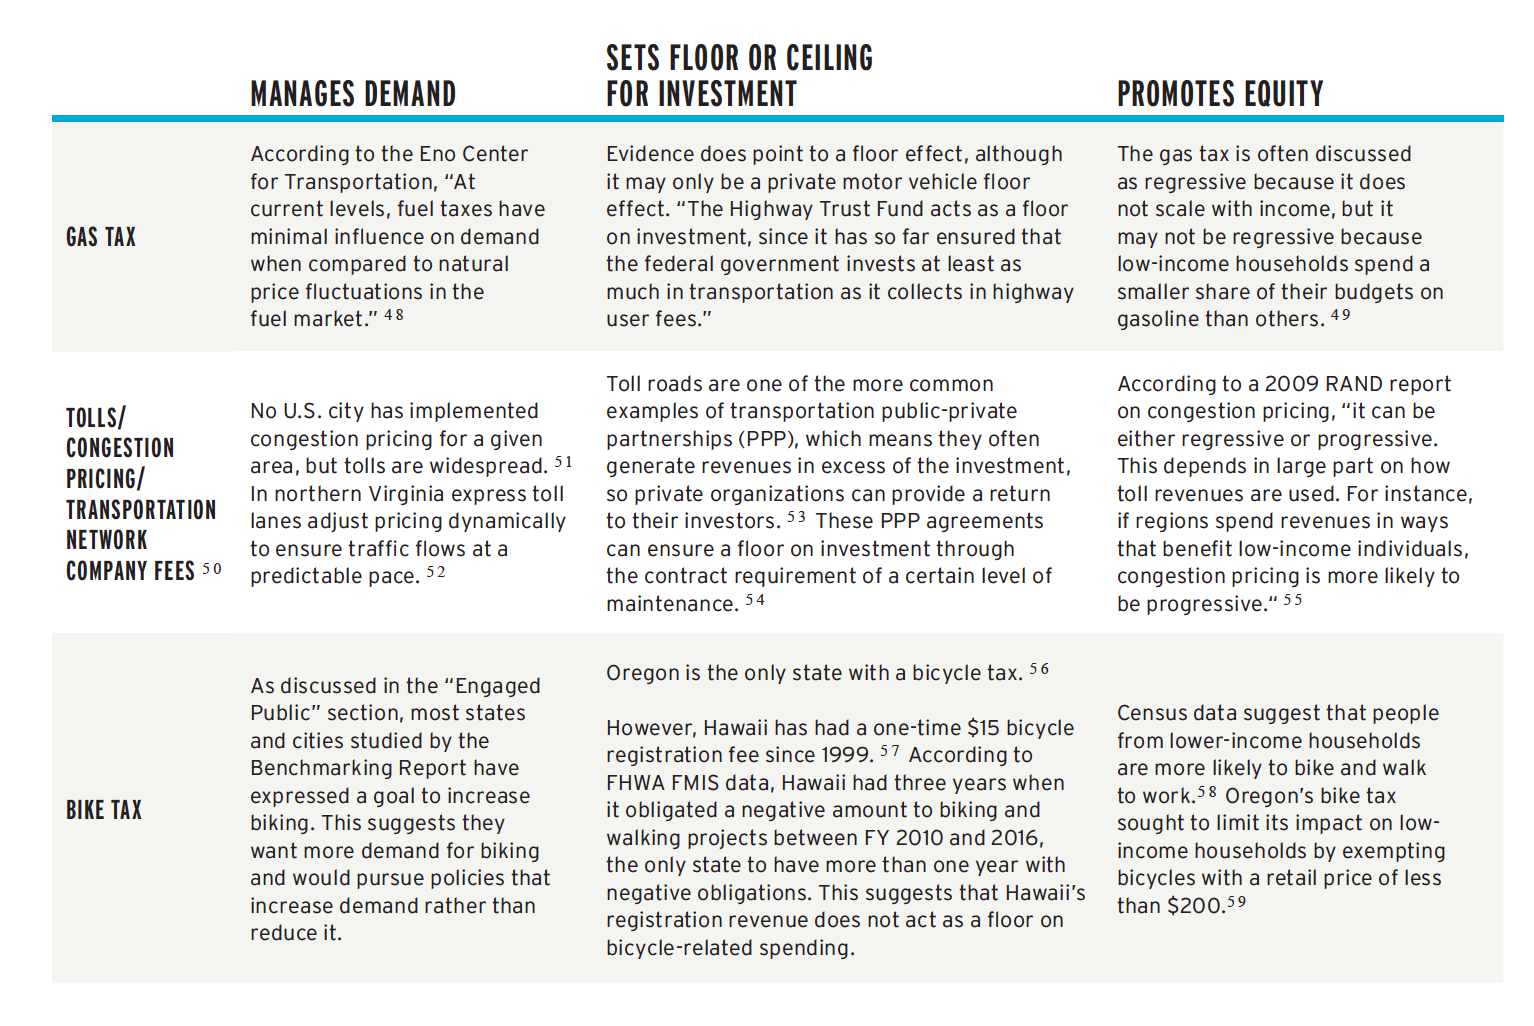
According to a 2015 report from the Eno Center for Transportation, “academic literature typically cites three major benefits from applying user fees in transportation:
- Managing demand. User fees can help manage demand by sending a signal to users. Set appropriately, fees can prevent overconsumption and minimize externalities.
- Setting a floor and a ceiling on investment levels. User fees send a signal to policy makers about how much to spend. If demand for transportation drops, available funds to spend will go down and vice-versa.
- Promoting equity. User fees can be a more equitable method of funding transportation than other revenue mechanisms, since users are the direct beneficiaries of the system.” 47
Using these three benefits of user fees as a guide, the following chart looks at the gas tax, tolls or other fees related to use, and potential bicycle taxes.
Footnotes 48 49 50 51 52 53 54 55 56 57 58 59
MAKING THE HEALTH CONNECTION: HEALTH IMPACT ASSESSMENTS PROVIDE INSIGHTS ON PROJECT OUTCOMES
Health Impact Assessments (HIAs) can be effective at better understanding the effects of current transportation funding and making the case for at least including biking and walking in road projects. While HIAs are often associated with quantifying the positive benefits of investments in active transportation, they can perhaps be more effective at quantifying the harm of auto-oriented development. A “rapid HIA” of a proposed road widening in Lee County, Florida, found negative health impacts to air quality, physical safety, and physical activity for the project that could be mitigated, but not overcome, by including sidewalks and bike lanes. 60
A review of 30 studies in Europe, Australia, New Zealand, and the United States found that active transportation has positive health benefits, with potential health risks caused by air pollution exposure and traffic crashes substantially outweighed by the positive effects of physical activity. 61 The Centers for Disease Control and Prevention has played a leading role in promoting Health Impact Assessments, funding one-third of the more than 350 HIAs completed in the United States. 62 A 2013 white paper from the Pedestrian and Bicycle Information Center found that 22 HIAs have evaluated plans and other proposals that prioritize bicycling and walking. 63 Transportation sector HIAs made up 21 of 81 HIAs reviewed by the U.S. Environmental Protection Agency in 2015. 64
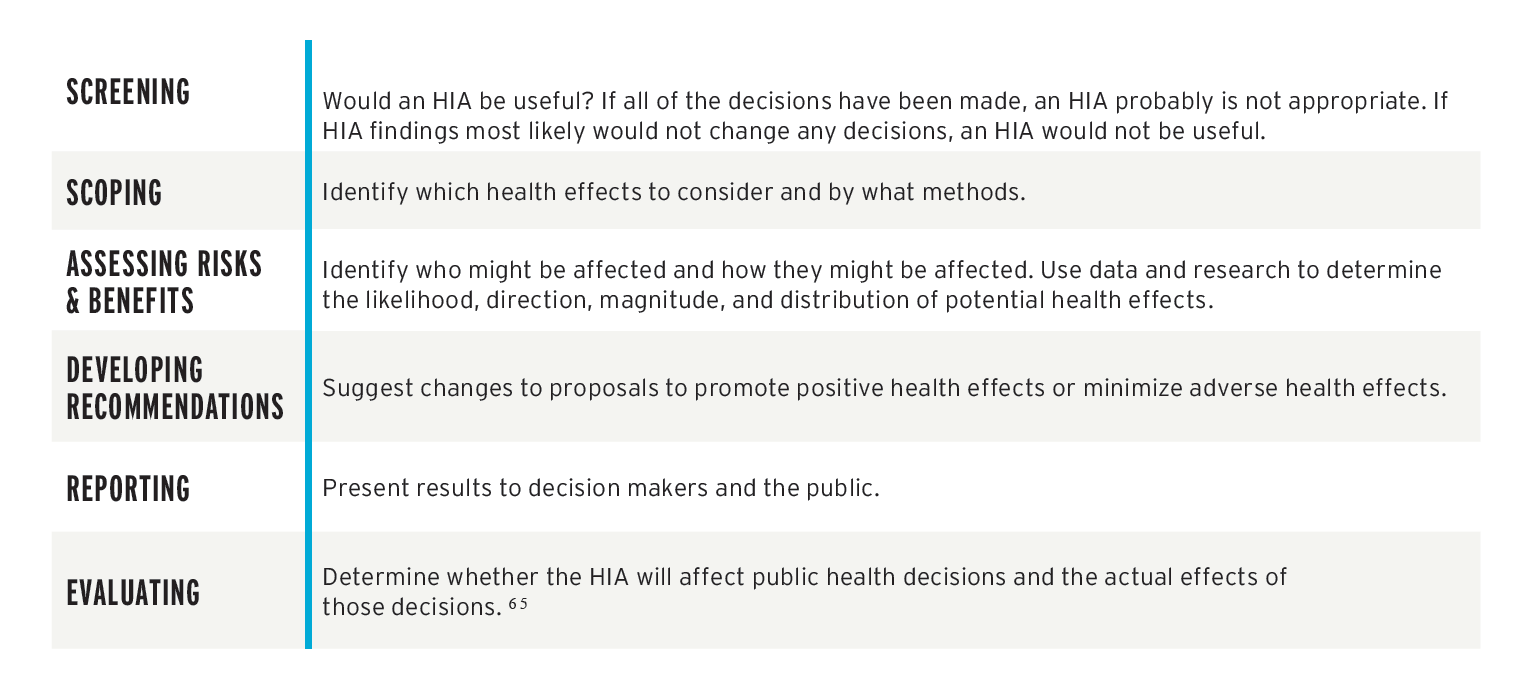
Footnote 65
The Pew Charitable Trusts (2014). Pew’s analysis of U.S. Census Bureau’s Annual Survey of State and Local Governments, 2007-2011. Available at http://pewtrusts.org/~/media/assets/2014/09/ff-transportation-report-horizontal-graphics_v3_123114.pdf.
The Pew Charitable Trusts (2014). Pew’s analysis of U.S. Census Bureau’s Annual Survey of State and Local Governments, 2007-2011 at Figures 1 and 7. Available at http://pewtrusts.org/~/media/assets/2014/09/ff-transportation-report-horizontal-graphics_v3_123114.pdf.
Federal Highway Administration. Funding Federal-Aid Highways Chapter 4 Obligation of Funding (January 2017). Available at https://www.fhwa.dot. gov/policy/olsp/fundingfederalaid/04.cfm.
Federal Highway Administration. Fiscal Management Information System Data for 2012-2016. U.S. Census Bureau. American Community Survey Table B01003 5-year estimate (2016). Available at https://factfinder.census.gov/faces/nav/jsf/pages/index.xhtml.
See Chapter IV: Show Your Data I: Nation.
See Chapter IV: Show Your Data I: Nation.
Rails to Trails Conservancy, designed by Lake Research Partners and Bellwether Research and fielded by professional interviewers from Sept. 9-14, American Voters Expect Federal Investment in Walking and Bicycling. Available at https://www.railstotrails.org/resourcehandler.ashx?id=5088.
P. Walker. The Guardian, Bike Blog (October 21, 2015). Cycling: Three quarters of Britons Support More Spending on Bike Use. Available at https://www.theguardian.com/environment/bike-blog/2015/oct/21/cycling-three-quarters-britons-support-more-spending-bike-use.
A. Bador and H. Haubold. European Cyclists’ Federation AGM Stockholm (May 28, 2016). Investments in Cycling and Cost-Benefit Analysis—Over- view and New Developments. Available at https://ecf.com/sites/ecf.com/files/AGM2016_Presentation_HO_CBA_Investment_v2.pdf.
A. Bador and H. Haubold. European Cyclists’ Federation AGM Stockholm (May 28, 2016). Investments in Cycling and Cost-Benefit Analysis—Over- view and New Developments. Available at https://ecf.com/sites/ecf.com/files/AGM2016_Presentation_HO_CBA_Investment_v2.pdf.
D. Katz. CoPIRG Foundation (August 17, 2016). Colorado Needs to invest $1.05 Billion Annually in Transit, Walking and Biking. Available at https:// copirgfoundation.org/news/cof/colorado-needs-invest-105-billion-annually-transit-walking-and-biking.
Washington State Department of Transportation. Washington State Bicycle Facilities and Pedestrian Walkways Plan, 2008-2027 at pp. 1 and Available at https://www.wsdot.wa.gov/NR/rdonlyres/F061CF6D-7B96-4E61-BF20-50EAF2716997/0/BikePedPlan.pdf.
B. Trask. Washington Bikes (July 10, 2015). Washington State Transportation Package Puts Biking Dollars at All-time High. Available at http://wabikes. org/2015/07/10/wa-state-transportation-package-puts-biking-dollars-at-all-time-high.
Washington State Department of Transportation. Announcing the WSDOT 2018 Active Transportation Planning Process. Available at https:// wsdot.wa.gov/bike/bike_plan.htm.
Federal Highway Administration. FHWA-HEP-14-035 (May 2014). Nonmotorized Transportation Pilot Program: Continued Progress in Developing Walking and Biking Networks at v. Available at https://www.fhwa.dot.gov/environment/bicycle_pedestrian/ntpp/2014_report/hep14035.pdf.
Washington State Department of Transportation. Announcing the WSDOT 2018 Active Transportation Planning Process at vi. Available at https:// wsdot.wa.gov/bike/bike_plan.htm.
Alameda County Transportation Commission. Measure BB Passed with 70 Percent Voter Support: Funds 30-Year Transportation Expenditure Plan (November 2014). Available at https:// alamedactc.org/2014Plan.
Alameda County Transportation Commission. 2014 Alameda County Transportation Expenditure Plan (January 2014) at 2. Available at https://www.alamedactc.org/files/managed/Document/12934/2014_Transportation_Expenditure_Plan.pdf.
Atlanta Bicycling Coalition (2018). The Renew Atlanta Bond, Passed in 2015, Including Funding for Complete Streets Projects. Available at http://www.org/renewatlanta.
Dr. Williams. Atlanta Business Chronicle. Report Shows Atlanta Bike Path Mileage Doubled Since 2012. Available at https://www.bizjournals.com/ atlanta/news/2018/03/14/report-shows-atlanta-bike-path-mileage-doubled.html.
M. Blau. Atlanta Magazine. Becky Katz Wants to Make Atlanta More Bicycle-friendly. She’s in for an Uphill Climb (February 12, 2016). Available at http://www.atlantamagazine.com/news-culture-articles/becky-katz-wants-to-make-atlanta-more-bicycle-friendly-shes-in-for-an-uphill-climb.
K. L. Bottoms. Atlanta City Council, Department of City Planning. City of Atlanta 2017 Annual Bike Report. Available at https://www.atlantaga.gov/ home/showdocument?id=34089.
City of Austin. The 2016 Mobility Bond Is Putting Austin in Motion. Available at https://data.austintexas.gov/stories/s/9krn-a66r.
City of Austin. Local Mobility Program. Available at https://data.austintexas.gov/stories/s/Local-Mobility-Program-Page/9jsz-agwf.
P. van Heuven. Bicycle Colorado. Bike and Pedestrian Groups Support Denver’s Go Bond Investments (August 21, 2017). Available at http://www.bicyclecolorado.org/wp-content/uploads/2017/09/DSP-Bond-Press-Re- lease.pdf.
Bicycle Colorado. Denver Initiative. Denver’s 2017 General Obligation (GO) Bond Delivers for Biking and Walking. Available at https://bicyclecolorado.org/initiatives/denver.
R. Monson. Frontburner. D Magazine. Go Inside Dallas’ New Cycling Plans a Bike Share Companies Flood the Streets (December 15, 2017). Available at https://www.dmagazine.com/frontburner/2017/12/is-dallas-finally-ready-to-become-bike-friendly.
K. Kalthoff. NBCDFW.com Channel 5. More Dallas Bike Lanes Are on the Way (December 21, 2017). Available at https://www.nbcdfw.com/news/ local/More-Dallas-Bike-Lanes-Are-on-the-Way-465789103.html.
R. Monson. Frontburner. D Magazine. Go Inside Dallas’ New Cycling Plans a Bike Share Companies Flood the Streets (December 15, 2017). Available at https://www.dmagazine.com/frontburner/2017/12/is-dallas-finally-ready-to-become-bike-friendly.
National League of Cities. Local Infrastructure Funding Report (December 8, 2016). Paying for Local Infrastructure in a New Era of Federalism. Available at https://www.nlc.org/resource/local-infrastructure-funding-report.
A. Tomer and J. Kane. Brookings (January 2018). Localities Will Deliver the Next Wave of Transportation Investments. Available at https://www.brookings.edu/research/localities-will-deliver-the-next-wave-of-transportation-investment.
K. Pomerleau. Tax Foundation. How High are Other Nations’ Gas Taxes? (March 3, 2015). Available at https://taxfoundation.org/how-high-are-other-nations-gas-taxes.
E. Jaffe. Citylab. The Real Reason U.S. Gas Is So Cheap Is Americans Don’t Pay the True Cost of Driving (January 5, 2015). Available at https://www.citylab.com/transportation/2015/01/the-real-reason-us-gas-is-so-cheap-is-americans-dont-pay-the-true-cost-of-driving/384200.
Ian Perry et al. International Monetary Fund (July 2014). Getting Energy Prices Right: From Principle to Practice. Available at http://www.elibrary.imf.org/view/IMF071/21171-9781484388570/21171-9781484388570/21171-9781484388570.xml?rskey=kHyJS5&result=1&highlight=true&redirect=true.
Lucas Davis. Energy Institute Blog (1/5/2015). Raise the Gas Tax. Available at https://energyathaas.wordpress.com/2015/01/05/raise-the-gas-tax/.
Michael Anderson and Max Auffhammer. C. Berkeley and NBER (final version accepted May 2013). Pounds that Kill: The External Costs of Vehicle Weight. Available at https://are.berkeley.edu/~mlanderson/pdf/anderson_auffhammer.pdf.
Irvin David. Planetizen (1/6/2015). California’s ‘Hidden Gas Tax’ Arrives, Goes Unnoticed. Available at https://www.planetizen.com/node/73115.
Donald Shoup. Access Magazine (Spring 2010). Fixing Broken Sidewalks. Available at https://accessmagazine.org/wp-content/uploads/ sites/7/2016/01/access-36brokensidewalks.pdf.
Anna Clark. NextCity (6/13/2016). Suing for Sidewalks. Available at https://nextcity.org/features/view/ada-compliance-accessible-design-cities-law- suits-doj.
Sarah Goodyear. Citylab (4/7/2015). Why L.A.’s $1.4 Billion Sidewalk Repair Case Is Such a Big Deal. Available at https://www.citylab.com/transportation/2015/04/why-las-14-billion-sidewalk-repair-case-is-such-a-big-deal/389793/.
U.S. Department of Justice Civil Rights Division. Project Civic Access Fact Sheet. Available at https://www.ada.gov/civicfac.htm.
Elliot Njus. The Oregonian (2/16/2018). 97% of sidewalk ramps along Oregon highways violate ADA standards, survey finds. Available at http://www.com/commuting/index.ssf/2018/02/97_of_sidewalk_ramps_along_ore.html.
Katherine Barrett and Richard Governing (April 2013). The Risks of Relying on User Fees. Available at http://www.governing.com/columns/smart-mgmt/col-risks-of-raising-non-tax-revenue.html.
Katherine Barrett and Richard Governing (April 2013). The Risks of Relying on User Fees. Available at http://www.governing.com/columns/smart-mgmt/col-risks-of-raising-non-tax-revenue.html.
George Skelton. Los Angeles Times (9/24/2015). Bicyclists shouldn’t get a free ride when it comes to repairing roads. Available at http://www.latimes.com/local/california/la-me-pol-sac-cap-20150924-column.html.
The Pew Charitable Trusts (2014). Pew’s analysis of U.S. Census Bureau’s Annual Survey of State and Local Governments, 2007-2011 at Figure 9. Available at http://pewtrusts.org/~/media/assets/2014/09/ff-transportation-report-horizontal-graphics_v3_123114.pdf.
Eno Center for Transportation. How We Pay for Transportation: The Life and Death of the Highway Trust Fund (December 2014) at p. 24. Available at https://www.enotrans.org/wp-content/uploads/2015/09/Highway-Trust-Fund.pdf?x43122.
Eno Center for Transportation. How We Pay for Transportation: The Life and Death of the Highway Trust Fund (December 2014) at p. 25. Available at https://www.enotrans.org/wp-content/uploads/2015/09/Highway-Trust-Fund.pdf?x43122.
James Poterba. National Bureau of Economic Research Working Paper 3578 (1991). Is the Gasoline Tax Regressive? Available at http://www.nber.org/papers/w3578 (“low expenditure households devote a smaller share of their budget to gasoline than do their counterparts in the middle of the expenditure ”)
Winnie Hu. New York Times (2/18/2018). When Calling an Uber Can Pay Off for Cities and States. Available at https://www.nytimes.com/2018/02/18/nyregion/uber-lyft-public-transit-congestion-tax.html.
Federal Highway Administration. Congestion Pricing: Examples Around the U.S. Available at https://ops.fhwa.dot.gov/congestionpricing/resources/ examples_us.htm and Chicago Metropolitan Agency for Planning. Congestion Pricing. Available at http://www.cmap.illinois.gov/mobility/roads/conges- tion-pricing.
TransUrban. Learn the Lanes. Available at https://www.expresslanes.com/learn-the-lanes.
Federal Highway Administration. Public-Private Partnership Concessions for Highway Projects: A Primer at p. 6. Available at https://www.fhwa.dot.gov/ipd/pdfs/p3/p3_concession_primer.pdf.
National Cooperative Highway Research Program. Legal Research Digest 51 (January 2009). Major Legal Issues for Highway Public-Private Partnerships at p. 17. Available at http://www.pwfinance.net/document/research_reports/Research%20Legal%20NCHRP.pdf.
LIisa Ecola and Thomas Light. RAND Corporation Technical Report (2009). Equity and Congestion Pricing: A Review of the Evidence. Available at https://www.rand.org/content/dam/rand/pubs/technical_reports/2009/RAND_TR680.sum.pdf.
Lizzy Acker. The Oregonian (July 7, 2017). Oregon just passed the only bike-specific tax in the country. Available at http://www.oregonlive.com/pacific-northwest-news/index.ssf/2017/07/oregon_just_passed_the_only_bi.html.
Tice Health Impact Assessment Team. Intermediate Health Impact Assessment: Tice Community Connectivity and Redevelopment Plan HIA (June 2015). Available at http://lee.floridahealth.gov/programs-and-services/environmental-health/pace-eh2/_documents/tice-hia-final-report.pdf.
Mueller et al. Preventive Medicine (July 2015). Health Impact Assessment of Active Transportation: A Systematic Review. Available at https://www. sciencedirect.com/science/article/pii/S0091743515001164.
Centers for Disease Control and Prevention. National Center for Environmental Health. CDC’s Built Environment and Health Initiative. Available at https://cdc.gov/nceh/information/built_environment.htm.
Laura Wagner. Pedestrian and Bicycle Information Center (January 2013). Using Health Impact Assessments to Evaluate Bicycle and Pedestrian Plans. Available at http://www.pedbikeinfo.org/cms/downloads/WhitePaper_HIA_PBIC.pdf.
U.S. Environmental Protection Agency. EPA/600/R-13/354 (December 2013). A Review of Health Impact Assessments in the U.S.: Current State-of- Science, Best Practices, and Areas for Improvement. Available at https://www.epa.gov/sites/production/files/2015-03/documents/review-hia.pdf.
Hawaii Department of Transportation. Bike Plan Hawaii Master Plan (2003). Chapter 3-Current Bicycling Conditions-3.1 Bicycle Registration and Licensing. Available at https://hidot.hawaii.gov/highways/files/2013/02/Bike-Plan-chapter3.pdf.
Brian McKenzie. U.S. Census Bureau. Modes Less Traveled – Bicycling and Walking to Work in the United States: 2008-2012 (2014) at p. 13. Available at https://www.census.gov/prod/2014pubs/acs-25.pdf.
Lizzy Acker. The Oregonian (July 7, 2017). Oregon just passed the only bike-specific tax in the country. Available at http://www.oregonlive.com/pacific-northwest-news/index.ssf/2017/07/oregon_just_passed_the_only_bi.html.
Centers for Disease Control and Prevention. Parks and Trails Health Impact Assessment Toolkit. Available at https://cdc.gov/healthyplaces/ parks_trails/default.htm.