Use this section to get to know people who bike and walk, and who work on issues related to biking and walking.
Making the Case: Prioritizing People, Not Just Performance Measures
- The Case of People as Policy: Who are Bicycle & Pedestrian Professionals?
- The Case for a Focus on Women
- The Case for Culture as a Priority
Advancing Understanding: The League’s Equity Assessment of the Bicycle Friendly Community Program
Making the Health Connection: Prioritizing Social Determinants of Health
Footnote 1
Footnote 2
MAKING THE CASE: PRIORITIZING PEOPLE, NOT JUST PERFORMANCE MEASURES
Within the transportation sector, there is a movement from person-based decision-making, perhaps exemplified at the federal level by earmarks, 3 to quantitative, metric-based decision-making defined by performance measures based on outcomes. 4 In 2012, federal legislators passed the Moving Ahead for Progress in the 21st Century Act (MAP-21), which established national goals and performance-based approaches for federal transportation planning. 5
As this movement to transparent, performance-based decision-making continues, further opportunities exist to continue advancing equity. Transparent, performance-based decision-making provides the opportunity for better public involvement and understanding, but affirmative action to ensure community involvement in the transportation decisions that affect them could be the primary goal and may be essential to improving transportation in the United States.
The Case of People as Policy: Who Are Bicycle & Pedestrian Professionals?
There is a saying that “people are policy,” meaning the people who work in a field or agency are the ones who ultimately deliver the policies proposed by elected officials and supported by the public. In the world of biking and walking, The Association of Pedestrian and Bicycle Professionals (APBP) is composed of the people who turn public support for biking and walking into projects and programs delivered by agencies.
APBP is “a community for practitioners working to create more walkable, bikeable places.” 6 The early history of APBP was heavily influenced by the decision of Congress to provide federal support for investments in biking and walking in the
Intermodal Surface Transportation Efficiency Act of 1991 (ISTEA). Prior to ISTEA, the federal government spent less than $7 million per year on biking and walking. 7 With ISTEA, Congress significantly increased the availability of funding for biking and walking, required state departments of transportation to have a bicycle and pedestrian coordinator on staff 8 and provided $1 million for a National Bicycling and Walking Study. 9
Federal support for biking and walking, and the National Bicycling and Walking Study, helped show that demand existed for an organization like APBP. The institutional support for biking and walking at the federal level created by ISTEA included a U.S. Department of Transportation-funded meeting of state bicycle and pedestrian coordinators in 1993. 10 The state bicycle and pedestrian coordinators, who were newly required by federal law, identified the need for better information exchange among people working on bicycle and pedestrian issues, ultimately incorporating APBP in 1998. Since its founding, APBP has grown to more than 1,200 members in the United States and Canada. 11
Although APBP was created in part by state bicycle and pedestrian coordinators, according to a 2016 survey of its membership, most members are now employed by local governments (30.4%) or private for-profit entities (30.8%). Regional, state, and federal government employees represent an additional 16.6% of APBP members, meaning that government employees and for-profit entities make up over three-quarters of APBP members, according to the 2016 survey. Nonprofit employees represent less than 10% of APBP members (8.9%).
Footnote 12
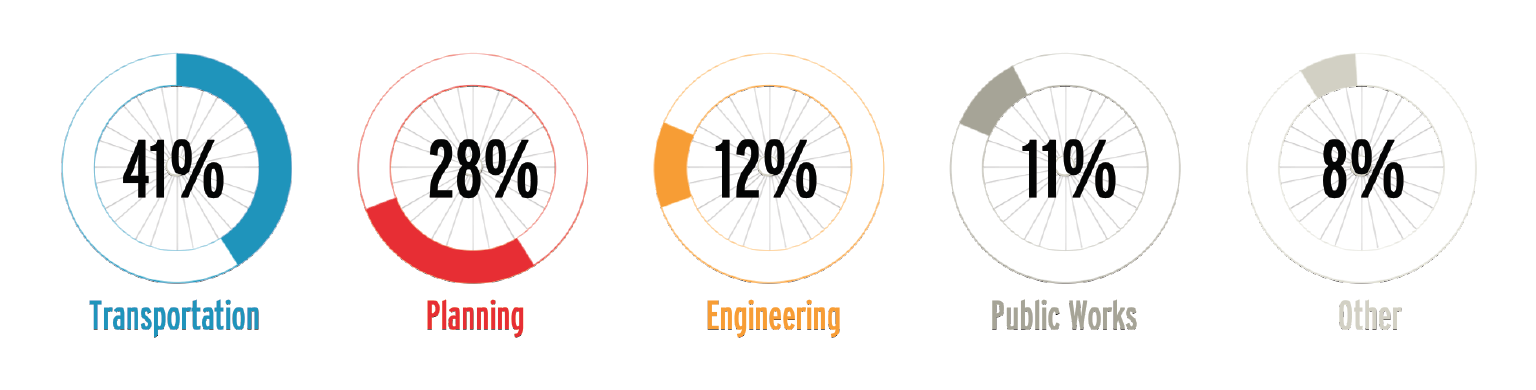
Of the slightly less than half of APBP members who work in government, not including universities, most work in either transportation (40.8%) or planning (27.7%) departments. Government employees from health and parks and recreation departments were less than 10% of APBP members who responded to the 2016 survey, representing 2.9% and 5% of APBP members, respectively. This low level of APBP participation by health department employees may reflect APBP’s founding on the basis of new federal support for biking and walking in transportation departments.
Footnote 13
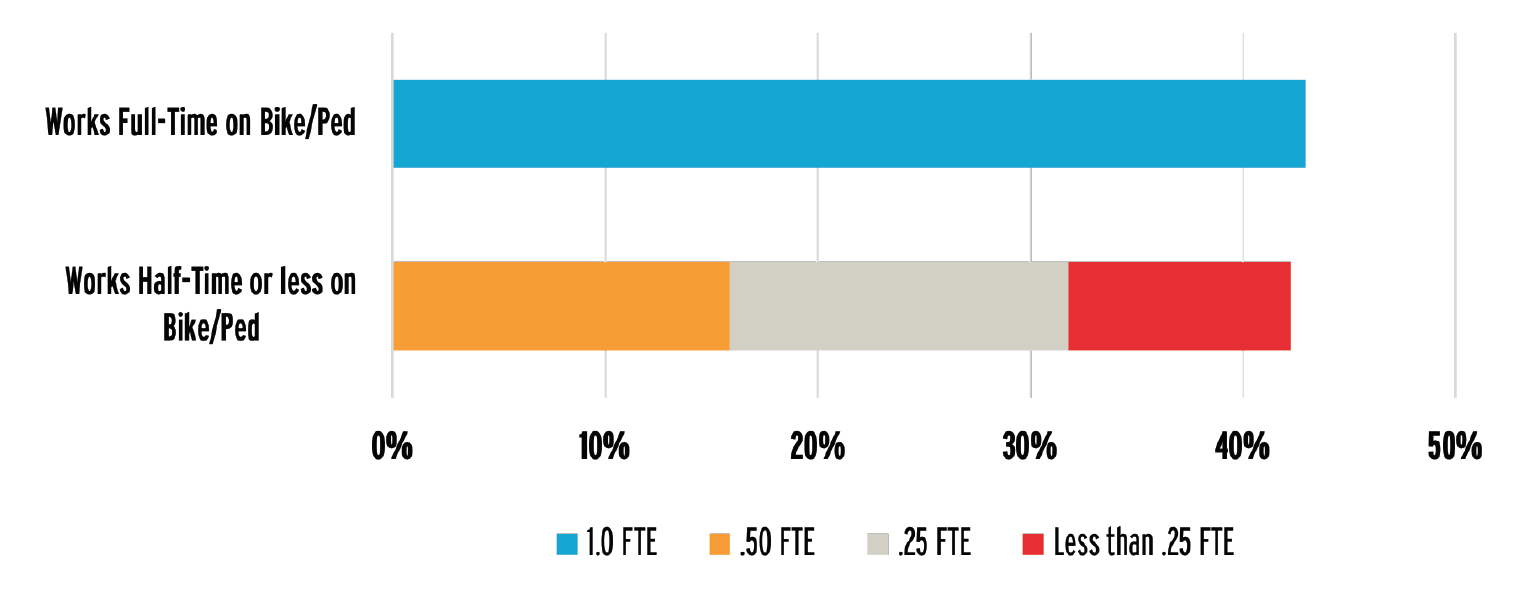
The members of APBP are committed to bettering bicycling and walking in the United States. The average APBP member reports that he or she has been working on bicycle and pedestrian issues for 10 years. However, fewer than half of APBP members reported that they get to spend all of their time on bicycle and pedestrian work (43%). A similar percentage of members reported that they spend 0.5 full-time equivalent (FTE) or less on bicycle and pedestrian work.
The Case for a Focus on Women to Improve Biking
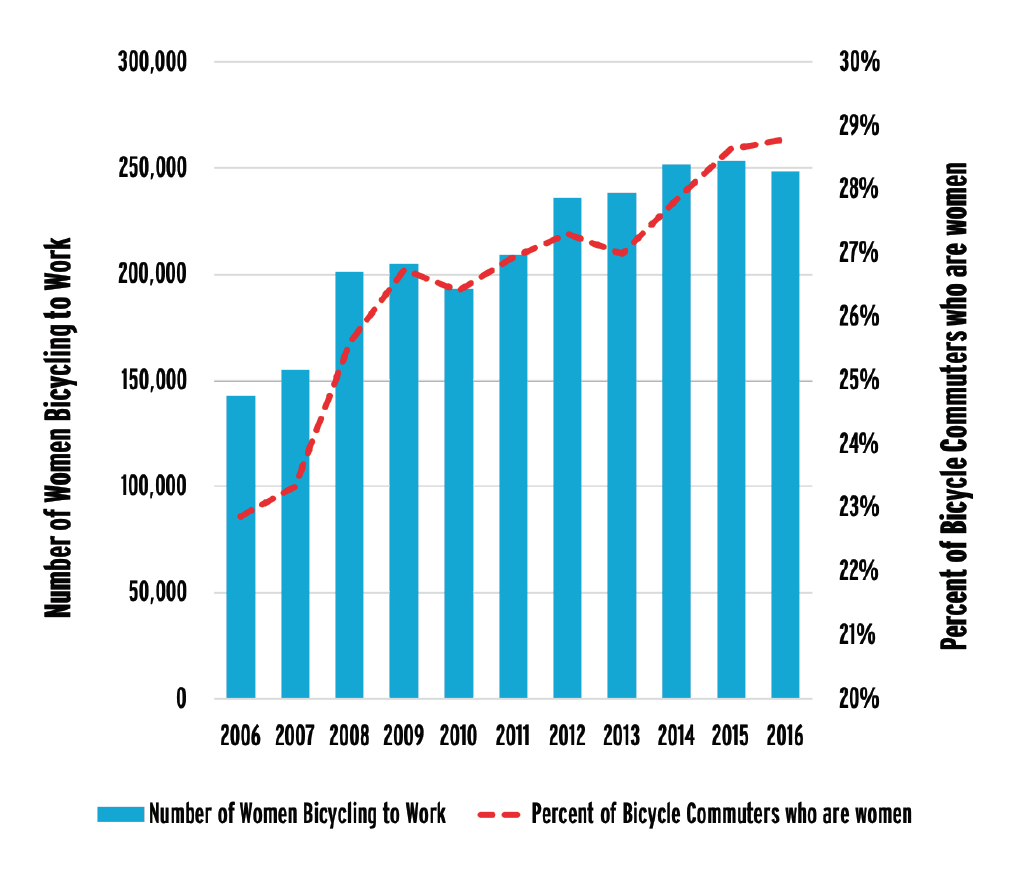
Equity in transportation often focuses on socioeconomic differences, but gender differences are important, too. Women are underrepresented among people who bike to work, but progress has been made in recent years. Using five-year American Community Survey (ACS) estimates, women have increased from 26% of bike commuters in 2010 to 28% of bike commuters in 2016. Over the same period, women have gone from 46.3% of walk commuters in 2010 to 46.1% of walk commuters in 2016. Women made up approximately 47% of all commuters in both 2010 and 2016.
Footnote 14
Between 2010 and 2016, the number of women biking to work increased by 59,522, representing 37% of bike commuters gained during that time.
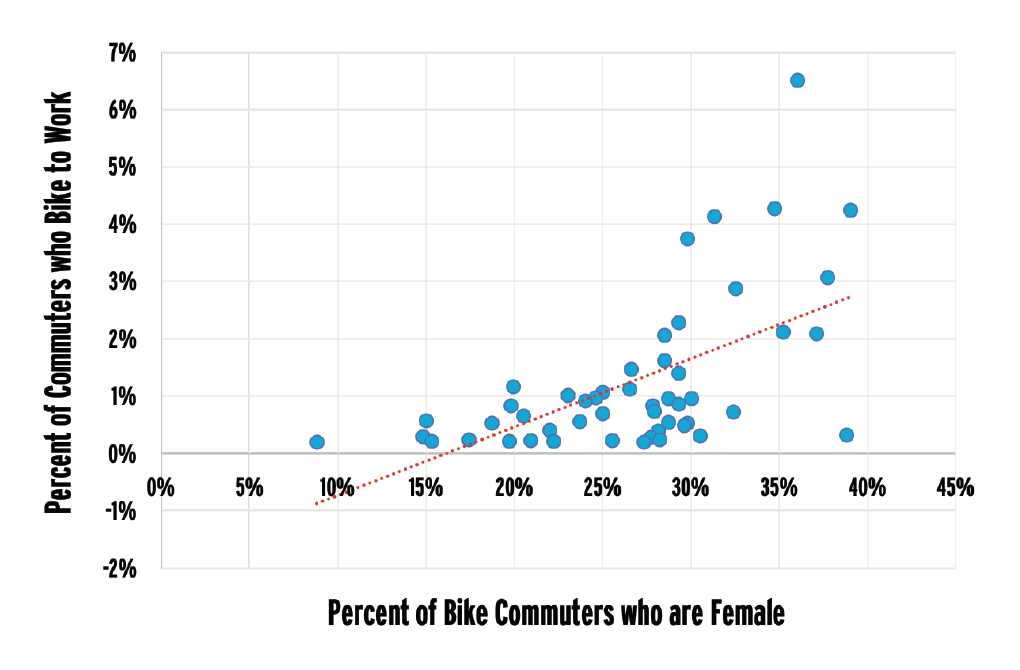
Among large cities, higher proportions of women bicycling to work are correlated with high rates of biking to work. For example, every city above a 2% bicycle commute mode share has a higher proportion of female bike commuters than the average large city.
As efforts are made to increase bicycling by women and other groups, it is important to understand the physical and non-physical challenges that they might face. One challenge that women face is street harassment, with a 2014 survey finding that 65% of women in the United States have experienced street harassment. That percentage is about 2.5 times the percentage of men (25%) who report street harassment. 16 According to the survey results, “[m]ost of the harassed persons said street harassment happened while they were on the street or sidewalk (67% of women and 43% of men), either on foot (such as walking, standing, sitting, or jogging) or on a bicycle or skateboard.” 17
A focus group of seven female bicyclists in Philadelphia suggested that education and public awareness campaigns publicizing bad traffic behaviors that are sometimes accompanied by sexualized harassment would be a positive step. 18 This is consistent with recommendations from the Safe Routes to School National Partnership that suggest addressing street harassment through workshops and trainings, providing student support and resources, and creating public awareness campaigns, among other efforts. 19
The Case for Culture as a Priority
Agencies and stakeholders are increasingly seeing the importance of complementing policy with culture as a way to improve safety. As vulnerable populations, including bicyclists and pedestrians, currently bear a disproportionate burden from traffic deaths this cultural change provides an opportunity for those vulnerable populations to benefit.
The U.S. Department of Transportation (U.S. DOT)’s Strategic Plan for FY2018-2022 20 makes safety its number one goal, with the strategic objective of creating a systemic safety approach. The plan includes a leadership strategy to: “Establish a departmental commitment to continually improve transportation safety by fostering a positive transportation safety culture across the transportation sector.” 21 According to the U.S. DOT, a safety culture is one that demonstrates a “commitment to safety over competing goals.” 22
Some organizations take a broader stance on the cultural drivers of safety. For example, in a white paper on traffic safety culture prepared for Toward Zero Deaths: A National Strategy on Highway Safety, “one risk factor that is not currently addressed by most traditional traffic safety paradigms is the ‘culture’ of the society defined by the driving population (and agencies that govern transportation safety). That is, a culture that tolerates or engages in risk while resisting safety interventions will propagate dangerous behaviors and impede traffic safety policy.” 23 This suggests that the development of a safety culture in agencies such as U.S. DOT, or that state DOTs who support Toward Zero Deaths may be impeded by outside cultural influences such as movies, expectations about mobile phone use, or other behaviors outside of the demonstrated behaviors within an agency.
The Complete Streets concept is to proactively include all street users in planning, design, construction, and operation of streets. This concept is now being translated into culture. Movements such as culturally competent Complete Streets focus not just on following a policy, but also on proactively incorporating the values and character of a community into the development of streets. In 2017, the National Complete Streets Coalition revised its Complete Streets policy elements to include considerations of equity into its policy review process. 24 “The best Complete Streets policies will specifically highlight communities of concern whom the policy will prioritize based on the jurisdiction’s composition and objectives.” 25
At the federal level, the FAST Act showed that Congress believes it is important to ensure that all users are included in transportation decision-making, which it achieves by requiring state transportation departments to take into account access for all users and modes of transportation when designing and building National Highway System roadways and by mandating that the Secretary of Transportation encourage states and MPOs to adopt safer road design standards inclusive of the needs for all road users. 26
As U.S. DOT and the state DOTs who support Toward Zero Deaths work to create a culture of safety, the movement to incorporate equity and inclusion through Complete Streets may provide a value lesson. By incorporating equity, the National Complete Streets Coalition is pushing communities to think about outside influences on what might affect a policy and its effectiveness at addressing vulnerable populations.
ADVANCING UNDERSTANDING: THE LEAGUE’S EQUITY ASSESSMENT OF THE BICYCLE FRIENDLY COMMUNITY PROGRAM
Between 2013 and 2014, the League of American Bicyclists underwent an internal equity assessment. The outcome of that effort included a report 27 on the League’s internal equity work. Among the key findings were the following:
- Equity, diversity, and inclusion (EDI) can be a great driver of innovation within an organizational structure since those concepts are integrated into each program rather than existing as a separate program.
- All organization stakeholders must be included in developing a commitment to EDI.
- All staff must be engaged through assessments of their programs.
- A team of stakeholders and staff should be designated to ensure continuity between work that deals with all programs and stakeholders engaged in the process.
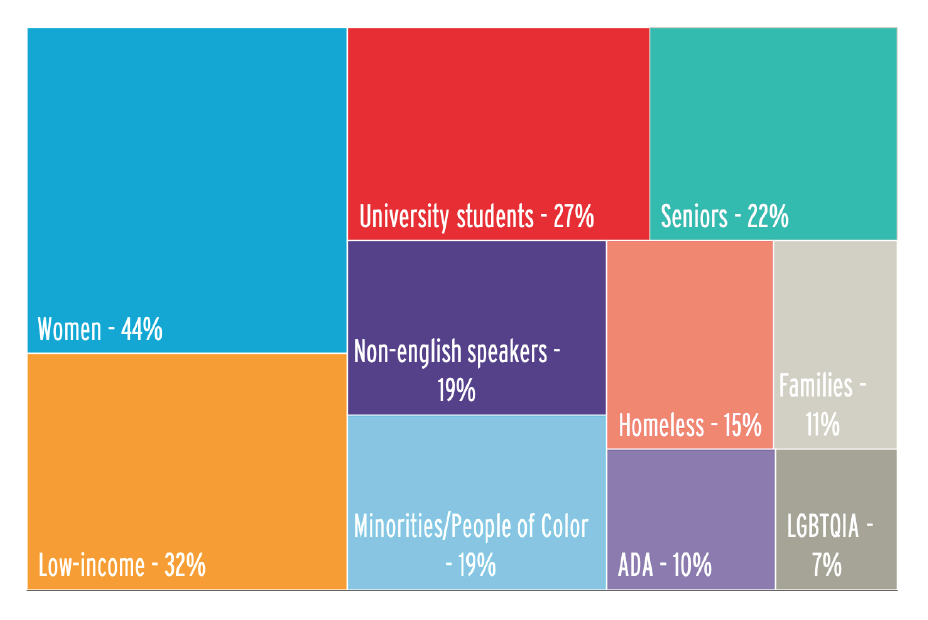
Based on the League’s Equity initiative and Women Bike program, changes were made to the Bicycle Friendly Community (BFC) program to collect and assess community efforts related to equity, diversity, and inclusion. An initial question for program communities was whether the community reflected the U.S. population. Based on 322 applications from spring 2015 to spring 2017, Bicycle Friendly Community applicants have higher median household incomes than the United States ($59,260 versus $55,775) and a higher percentage of white populations (67.7% of BFC populations are non-Hispanic whites, while only 62.3% of the United States population is non-Hispanic white).
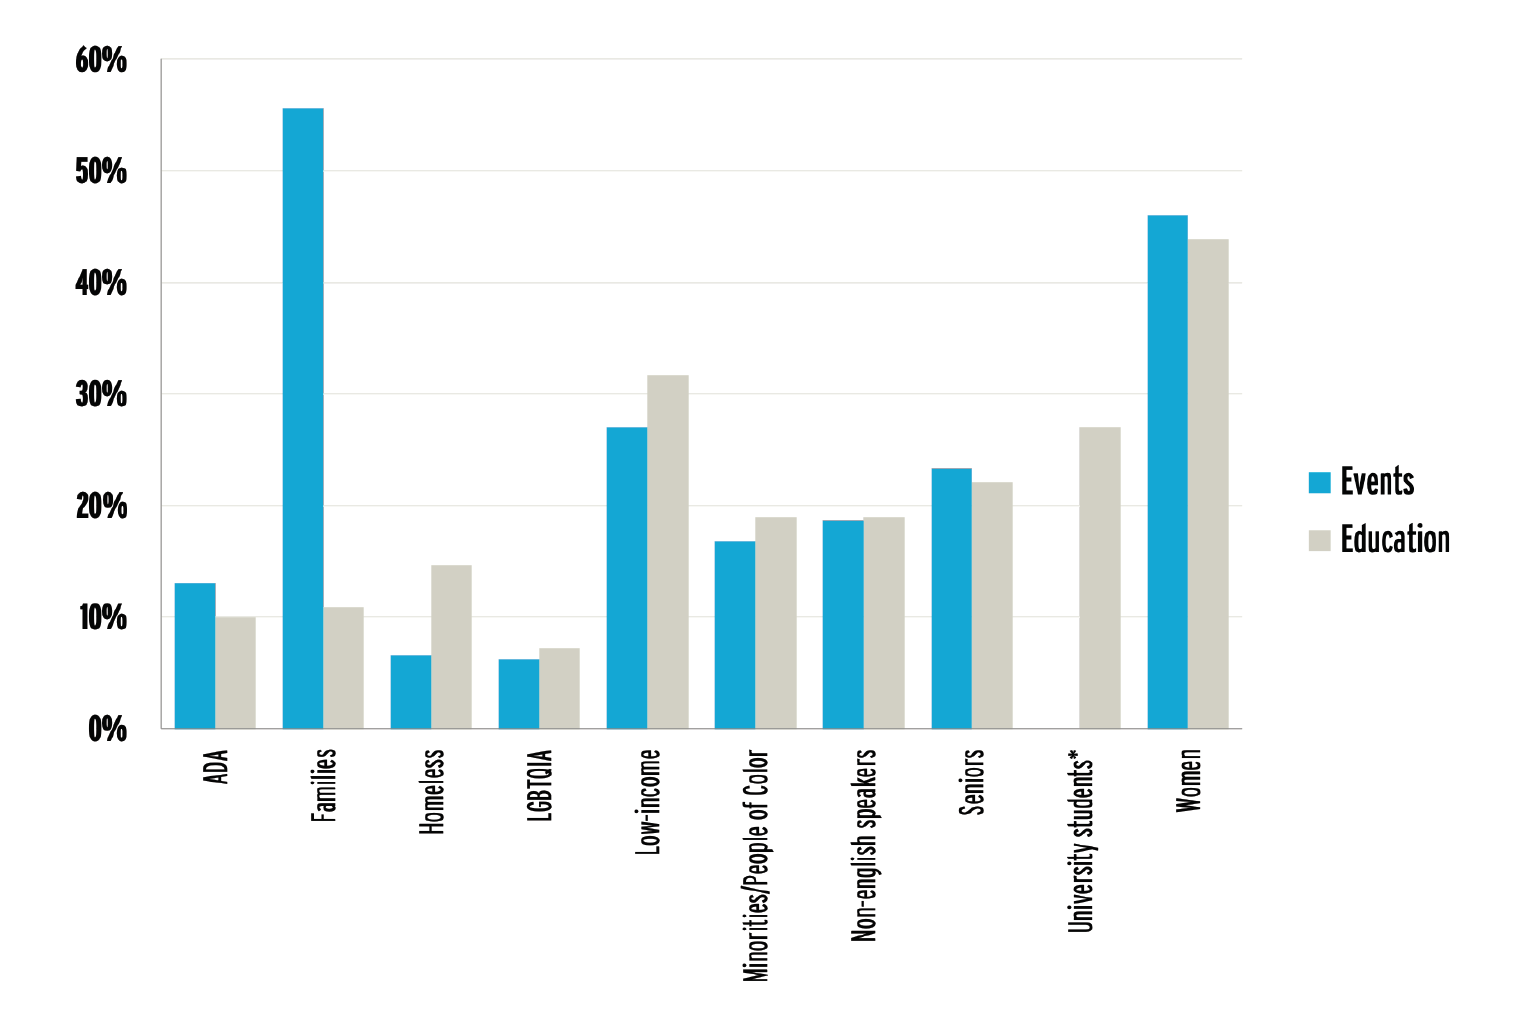
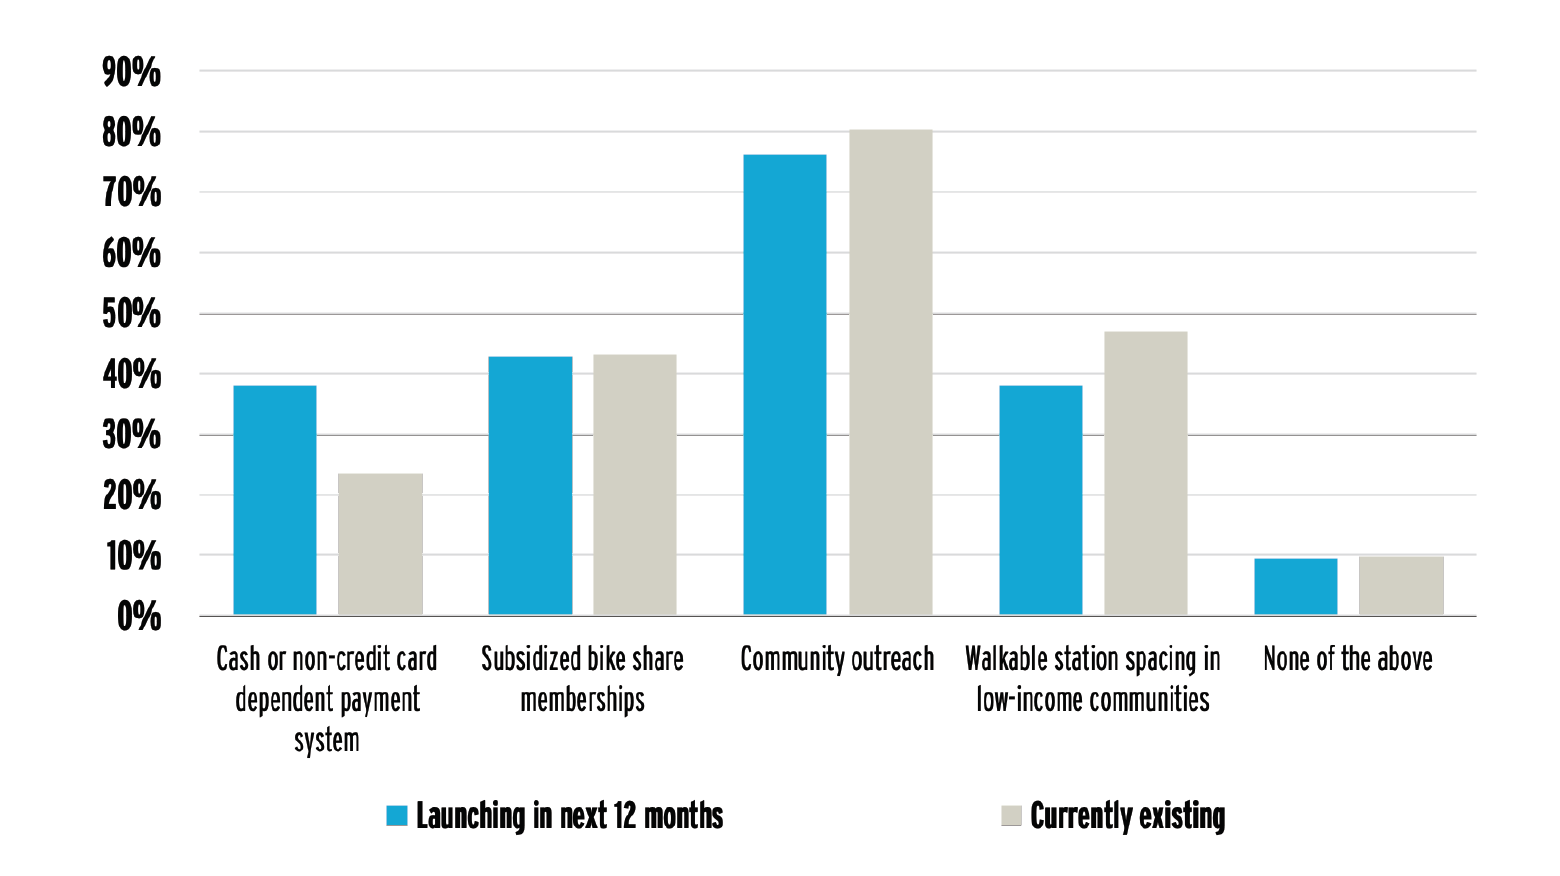
The League’s internal equity assessment led to numerous changes to the BFC application. Data below are from six questions added as a result of the League’s equity work.
Footnote 28
Footnote 29
Footnote 30
MAKING THE HEALTH CONNECTION: PRIORITIZING SOCIAL DETERMINANTS OF HEALTH
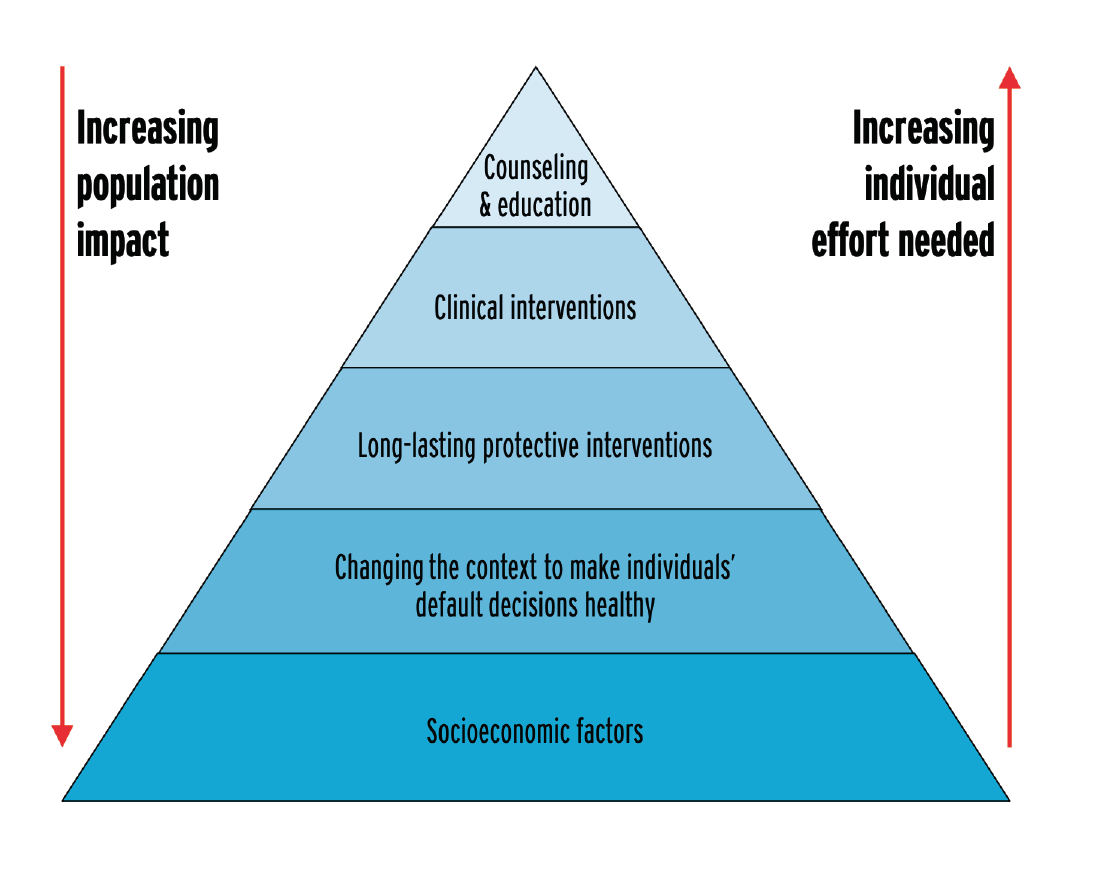
In 2010, then-Director of the Centers for Disease Control and Prevention Dr. Thomas Frieden published “A Framework for Public Health Action: The Health Impact Pyramid.” 31 The framework proposed by Dr. Frieden placed socioeconomic determinants of health at the base of his pyramid of public health actions because they are pervasive, have a strong correlation with health, and are underdeveloped worldwide, contributing greatly to public health problems such as lack of clean water and sanitation.
Footnote 32
Footnote 33
The second level of the Health Impact Pyramid presents the area in which people promoting biking and walking likely work: changing the context (through environmental and policy change), so an individual’s default decisions are healthy by including physical activity in their transportation choices. The concept of the Health Impact Pyramid helps show how socioeconomic factors relate to the current work done to change the context of decisions and suggests that engaging in changing socioeconomic factors would support healthier communities.
Sara Zimmerman, Michelle Lieberman, Karen Kramer, and Bill Safe Routes to School National Partnership. At the Intersection of Active Transportation and Equity (2014) at p. 3. Available at https://www.saferoutespartnership.org/sites/default/files/resource_files/at-the-intersection-of-active-transportation-and-equity.pdf.
Robert Wood Johnson Foundation. Visualizing Health Equity: One Size Does Not Fit All Infographic. Available at https://rwjf.org/en/library/infographics/visualizing-health-equity.html.
Earmarks were stopped as a practice in Rollcall Staff. Rollcall (7/30/2014). The Congressional Earmark Ban: the Real Bridge to Nowhere. Available at https://www.rollcall.com/news/the_congressional_earmark_ban_the_real_bridge_to_nowhere_commentary-235380-1.html. (“The Congressional Research Service specifically defined earmarks as ‘provisions associated with legislation (appropriations or general legislation) that specify certain congressional spending priorities or in revenue bills that apply to a very limited number of individuals or entities….’”)
Cambridge Systematics. National Cooperative Highway Research Program Report 446 (2000). A Guidebook for Performance-Based Transportation Planning at p. 3. Available at https://onlinepubs.trb.org/onlinepubs/nchrp/nchrp_rpt_446.pdf (“The impetus for these planning efforts is a group of factors that have increased awareness of a more broad range of goals and objectives for transportation, and that have helped identify the diverse set of customers that the system must serve.”)
Federal Highway Administration. Model Long-Range Transportation Plans: A Guide for Incorporating Performance-Based Planning (August 2014) at p. 4. Available at https://www.ssti.us/wp/wp-content/uploads/2014/10/fhwahep14046.pdf.
Association of Pedestrian and Bicycle Professionals. Mission and History. Available at https://apbp.org/page/Mission_and_History.
Susan Handy, Barbara McCann, Linda Bailey, et U.C. Davis (7/1/2009). The Regional Response to Federal Funding for Bicycle and Pedestrian Projects. Available at https://escholarship.org/uc/item/26j7x815.
Pedestrian and Bicycle Information Center. FAQ Results-What is a state Bicycle/Pedestrian Coordinator, and What are the Coordinator’s primary responsibilities? Available at http://www.pedbikeinfo.org/data/faq_details.cfm?id=3308.
Pedestrian and Bicycle Information Center. The National Bicycling and Walking Study: 15-Year Status Report (May 2010) at Available at http://www.pedbikeinfo.org/cms/downloads/15-year_report.pdf.
Association of Pedestrian and Bicycle Professionals. Mission and History. Available at https://apbp.org/page/Mission_and_History.
Association of Pedestrian and Bicycle Professionals. Mission and History. Available at https://apbp.org/page/Mission_and_History.
Association of Pedestrian and Bicycle Professionals. Member Survey data collected in 2016.
Association of Pedestrian and Bicycle Professionals. Member Survey data collected in 2016.
U.S. Census Bureau. American Community Survey Table B08006 1-year estimates (2006-2016). Available at https://factfinder.census.gov/faces/nav/ jsf/pages/index.xhtml.
U.S. Census Bureau. American Community Survey Table B08006 5-year estimate (2016). Available at https://factfinder.census.gov/faces/nav/jsf/pag- es/index.xhtml. National Highway Traffic Administration (NHTSA). Fatality Analysis Reporting System (FARS) Encyclopedia (2012-2016). Available at https://www-fars.nhtsa.dot.gov/Main/index.aspx.
Stop Street Harassment. 2014 National Street Harassment Report. Available at http://www.stopstreetharassment.org/ourwork/nationalstudy/.
Stop Street Harassment. Unsafe and Harassed in Public Spaces: A National Street Harassment Report (2014) at p. 21. Available at http://www.stopstreetharassment.org/wp-content/uploads/2012/08/National-Street-Harassment-Report-November-29-20151.pdf.
Stop Street Harassment. Unsafe and Harassed in Public Spaces: A National Street Harassment Report (2014) at p. 58. Available at http://www.stopstreetharassment.org/wp-content/uploads/2012/08/National-Street-Harassment-Report-November-29-20151.pdf.
Safe Routes to School National Partnership. Fact Sheet – Street Harassment and Safe Routes to School (2017). Available at https://www.saferoutespartnership.org/sites/default/files/resource_files/street_harassment_and_srts_fact_sheet.pdf.
U.S. Department of Transportation. Strategic Plan for FY2018-2022. Available at https://www.transportation.gov/sites/dot.gov/files/docs/mission/administrations/office-policy/304866/dot-strategic-plan-fy2018-2022508.pdf.
U.S. Department of Transportation. Strategic Plan for FY2018-2022 at p. 7. Available at https://www.transportation.gov/sites/dot.gov/files/docs/mission/administrations/office-policy/304866/dot-strategic-plan-fy2018-2022508.pdf.
U.S. Department of Transportation. Strategic Plan for FY2018-2022 at p. 15. Available at https://www.transportation.gov/sites/dot.gov/files/docs/mission/administrations/office-policy/304866/dot-strategic-plan-fy2018-2022508.pdf.
Nicholas J. Ward, Jeff Linkenbach, Sarah Keller, and Jay Otto. Western Transportation Institute, College of Engineering, Montana State University. White Paper No. 2. Prepared July 7, 2010, for Toward Zero Deaths: A National Strategy on Highway Safety. Available at http://www. towardzerodeaths.org/wp-content/uploads/Draft_TZD_White_Paper_2_Safety_Culture.pdf (draft).
Smart Growth America and National Complete Streets Coalition. The Elements of a Complete Streets Policy: Effective 2018. Available at https://smartgrowthamerica.org/app/uploads/2017/12/CS-Policy-Elements__2017.11.30.pdf.
Smart Growth America and National Complete Streets Coalition. The Elements of a Complete Streets Policy: Effective 2018 at p.4. Available at https://smartgrowthamerica.org/app/uploads/2017/12/CS-Policy-Elements__2017.11.30.pdf.
American Heart Fixing America’s Surface Transportation Act (FAST Act). (HR 22 sec. 1442. “Safety for Users” requires the Secretary to encourage standard adoption). Available at http://www.heart.org/HEARTORG/General/FAST-Act_UCM_480915_Article.jsp#.WtduqYjwYdU. See also National Complete Streets Coalition. How does the FAST Act impact Complete Streets projects? Available at https://smartgrowthamerica.org/app/lega- cy/documents/Complete-Streets-FAST-Act-One-Pager.pdf.
Dr. Adonia Lugo. The League of American Bicyclists. Integrating Equity in Bike Advocacy: An Interim Report on Internal Equity Assessment at the League of American Bicyclists (June 2014). Available at http://bikeleague.org/sites/default/files/League_internal_equity_web.pdf.
The League of American Bicyclists. Bicycle Friendly Community application data (Fall 2015 and Spring 2017).
The League of American Bicyclists. Bicycle Friendly Community application data (Fall 2015 and Spring 2017) (*University students were only included in questions about education).
The League of American Bicyclists. Bicycle Friendly Community application data (Fall 2015 and Spring 2017).
Thomas R. Frieden. American Journal of Public Health (April 2010). A Framework for Public Health Action: The Public Impact Pyramid. Available at https://www.ncbi.nlm.nih.gov/pmc/articles/PMC2836340.
World Health Organization. Final Report of the Commission on Social Determinants of Health. Geneva, Switzerland: World Health Organization (2008). Closing the Gap in a Generation: Health Equity through Action on the Social Determinants of Health. Available at: http://whqlibdoc.who.int/publications/2008/9789241563703_eng.pdf.
Thomas R. Frieden. New England Journal of Medicine (October 29, 2015). The Future of Public Health. Available at http://www.nejm.org/doi/ full/10.1056/NEJMsa1511248.