IN THIS SECTION, THE BENCHMARKING REPORT DISCUSSES TOPICS THAT LOOK AT TRANSPORTATION SAFETY WITH A FOCUS ON THE SAFETY OF PEOPLE WHO BIKE AND WALK.
This includes how the United States compares to peer countries in terms of road safety, as well as how road safety is a public health problem. This section also acknowledges limitations in bicyclist and pedestrian-related data in terms of how the safety of bicyclists and pedestrians is measured. Originally printed as part of the 2018 Benchmarking Report on Bicycling and Walking in the United States, citations can be found in the pdf available at https://bikeleague.org/sites/default/files/Benchmarking_Report-Sept_03_2019_Web.pdf.
Use this section to learn more about traffic safety issues in the United States and how bicycling and walking are a part of a safer transportation system. To give attention to recent efforts to change the traffic safety culture in the United States, this section is split into two sections, which can be accessed below:
U.S. MOVEMENTS FOR ZERO ROAD DEATHS
PRIORITIZING BICYCLIST & PEDESTRIAN SAFETY IN TRAFFIC SAFETY EFFORTS
- The Case for Making the Best of Limited Safety Data on Biking & Walking
- The Case for Safety in Numbers
- The Case for Mode Shift as a Traffic Safety Intervention
ADVANCING UNDERSTANDING: CURRENT LIMITATIONS ON UNDERSTANDING BICYCLING & WALKING SAFETY
EMBRACING EQUITY: CURRENT TRAFFIC SAFETY PROBLEMS AS A REFLECTION OF DEMOGRAPHIC DIFFERENCES
The United States ranks worse than many comparable nations in traffic safety. According to a 2010 special report by the Transportation Research Board (TRB), “In recent decades nearly every high-income country has made more rapid progress than has the United States in reducing the frequency of road traffic deaths and the rate of deaths per [mile] of vehicle travel.” According to a 2017 report by Ralph Buehler and John Pucher, between 1990-1994 and 2010-2014, the United States made the least progress of 11 Organization for Economic Co-operation and Development (OECD) countries in reducing pedestrian and bicyclist fatality rates per capita.
According to the National Highway Traffic Safety Administration, 37,461 people died in motor vehicle crashes in 2016, including 5,987 pedestrians (15.98%), and 840 bicyclists (2.24%). In 2016, more bicyclists died than in any year since 1991 and more pedestrians died than in any year since 1990.
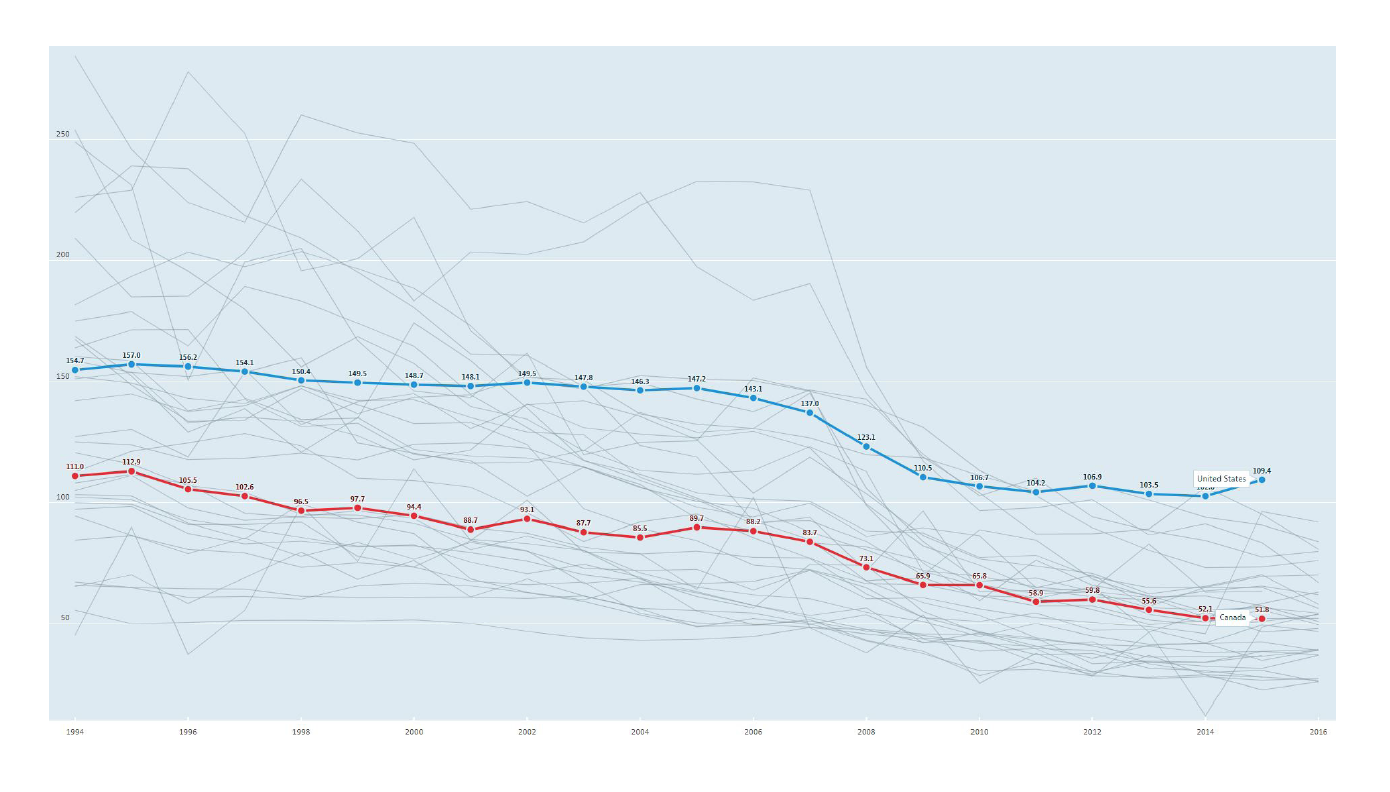
The United States has the worst record of traffic fatalities per 1,000,000 inhabitants of the 35 OECD countries that shared traffic fatality data in 2015. The rate of traffic fatalities per 1,000,000 inhabitants is slightly more than twice what it is in Canada (the U.S. has a rate of 109.4 deaths per million inhabitants, while Canada has a rate of 51.8). As discussed in the Transportation Research Board report, “The experience of these benchmark nations indicates that the successful national programs function effectively at three levels of activity:” 1) management and planning, 2) technical implementation of specific countermeasures, and 3) political support and leadership.
U.S. MOVEMENTS FOR ZERO ROAD DEATHS
The state of road safety in the United States has led to several distinct movements organized around the concept that all traffic deaths are preventable and that the only acceptable number of traffic deaths is zero. The concept of framing traffic safety in this way and pursuing an approach that can achieve the goal of zero traffic fatalities began in 1994 in Sweden and was codified in Swedish law by a 1997 Traffic Safety Bill. Since 1997, Sweden has exported its concept and strategies to more than 60 countries. In 2016, Sweden experienced 270 traffic fatalities, with 27.3 traffic deaths per 1,000,000 inhabitants– about a quarter the per capita traffic fatality rate of the United States. In the United States, three organizations or initiatives incorporate the idea of Vision Zero into their missions. The following summarizes each group and its work to help people interested in how the work of these groups impacts people who bicycle and walk.
Toward Zero Deaths
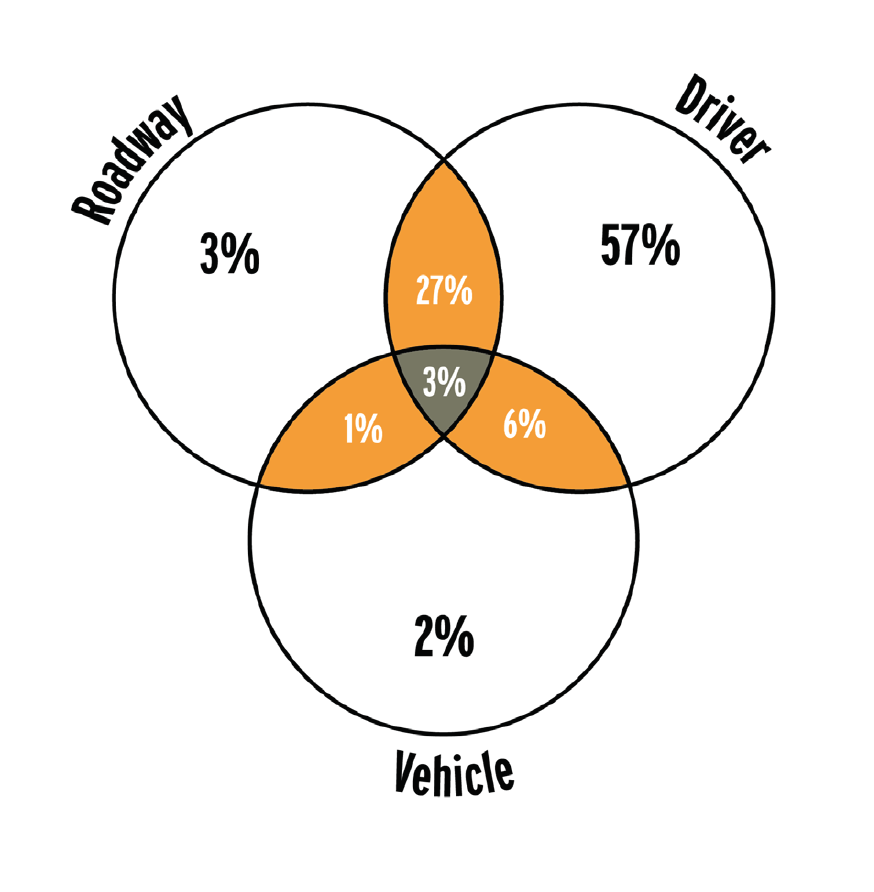
Started in 2009, the Toward Zero Deaths movement is composed of national traffic safety organizations and state departments of transportation. Of the Vision Zero-related groups, it is the most centered on individual behaviors. Examples of this focus can be found in the assertion that “[t]he element of the transportation system that contributes most frequently to the occurrence of traffic crashes is the driver” and the Venn diagram produced in the Towards Zero Deaths Strategy that identifies how drivers, vehicles, and roadways contribute to traffic deaths.
When dealing with bicyclists and pedestrians, this group says, “Successfully protecting vulnerable road users relies on a combination of improving infrastructure and planning, enacting, and enforcing legislation, and targeting education programs to specific road user audiences. These initiatives may require that road users behave in a certain way or use protective equipment, which can generate controversies related to personal freedoms, privacy, and the ability to enforce laws.” 13
Interventions proposed by the Toward Zero Deaths movement often focus on individual behavior and stress balancing safety and mobility when creating the built environment. 14 As an example, the Toward Zero Deaths’ National Strategy says, “Elements of the roadway environment, including travel lanes for all motorized vehicles, traffic signs and signals, and bus stops and other transit access points, must be designed to balance the safety and mobility of all travel modes expected to use the roads. This balance is challenging because of the different characteristics and needs of each type of road user. Road designers must evaluate the expected effect of infrastructure treatments on all types of road users—even treatments intended to address the contributing factors for crashes involving vulnerable users—to make the most appropriate decision for individual situations.” While human behavior may be the primary focus of the Toward Zero Deaths movement, there appears to be no discussion of important contexts that impact human behavior such as land use, access to a vehicle, or poverty that may impact the mode choice or behaviors of people in different communities beyond the design of a road in its strategy.
Road to Zero Coalition
Started in 2016, the Road to Zero Coalition includes many of the organizations involved in Toward Zero Deaths but is a notably broader movement led by the National Safety Council and several federal agencies. The Road to Zero Coalition also has a more specific goal: “To eliminate traffic fatalities by 2050.” As of January 2018, the Road to Zero Coalition had 629 members, including 156 advocacy and survivor advocacy groups. In April 2018, the Road to Zero Coalition published its first report, “The Road to Zero: A Vision for Achieving Zero Roadway Deaths by 2050.”
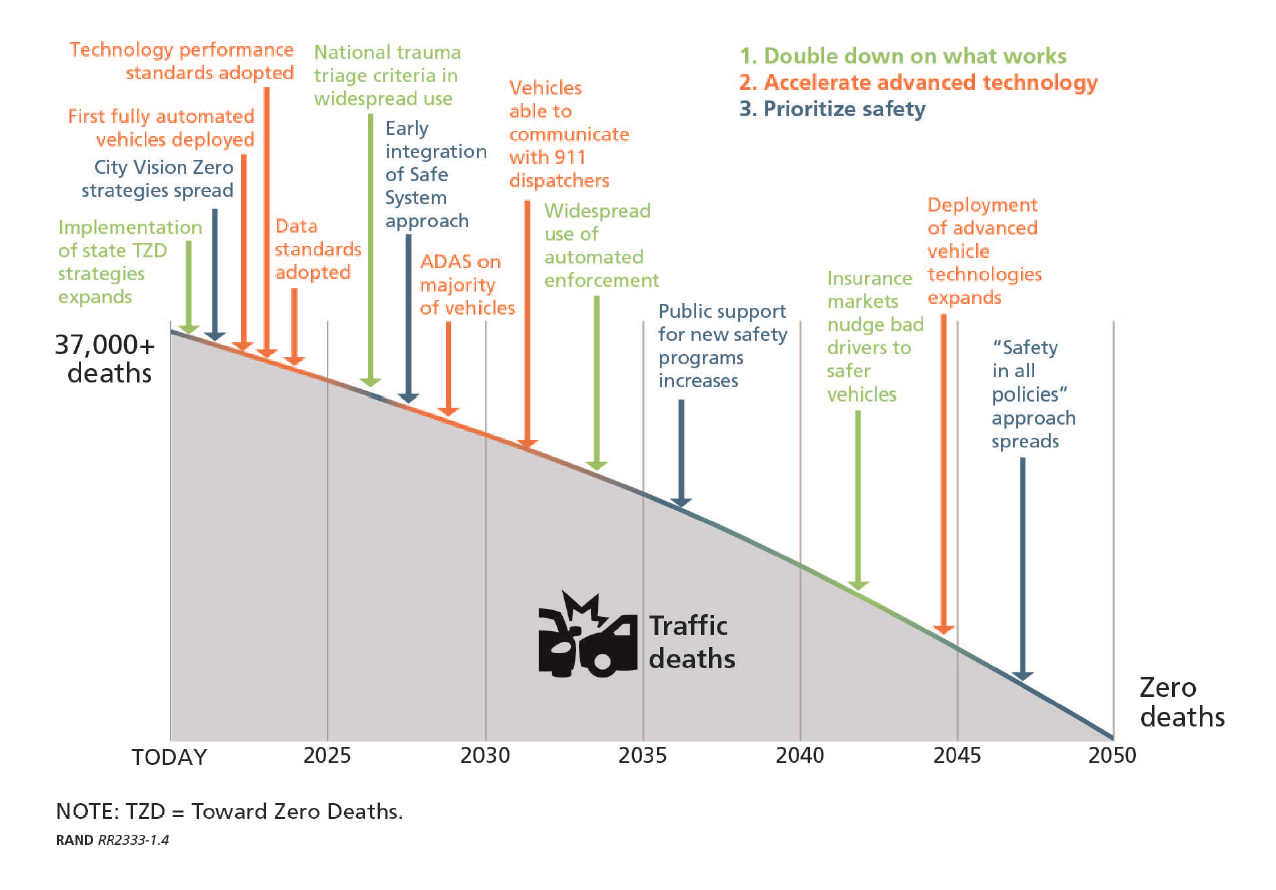
The Road to Zero Coalition outlined three approaches to achieve zero roadway deaths by 2050:
1 » DOUBLE DOWN ON WHAT WORKS
Use the established network of traffic safety experts in the United States while engaging businesses and political leaders to a greater extent to provide new energy to traffic safety efforts.
2 » ACCELERATE ADVANCED TECHNOLOGY
Continue and reinforce deployment of advanced vehicle technologies while creating new partnerships with emergency medical and trauma systems and others in the public sector to increase the speed of new-technology adoption in all aspects of the traffic safety system.
3 » PRIORITIZE SAFETY
Create a safety culture and spread the adoption of the Safe System approach. “Adopting the Safe System approach involves a fundamental shift from the common assumption that crashes generally happen because of people’s behavior.” 18
The Road to Zero Coalition goes on to present three principles of a Safe System approach:
While each of the principles above is important, the most dramatic change of a Safe System approach is the shift of responsibility from the individual user of the roadway to the people who design the transportation system. While the Toward Zero Deaths National Strategy assigns 57% of the responsibility to drivers, the Safe System approach appears to place the majority of responsibility on the “people who design the transportation system— city planners, traffic engineers, and vehicle designers” 20 rather than individuals using the system.
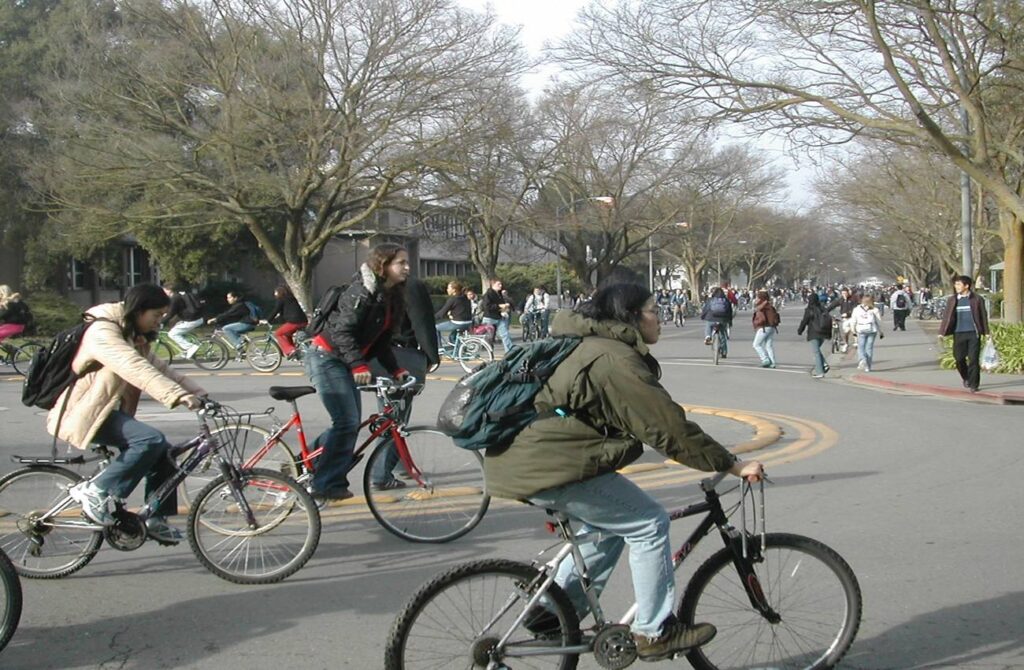
BFA – Bicycle Roundabout, courtesy of UC-Davis
Vision Zero Network
Started in 2014, the Vision Zero Network is committed to helping communities reach their goal of Vision Zero–”eliminating all traffic fatalities and severe injuries while increasing safe, healthy, equitable mobility for all.” The Vision Zero Network articulates its goal and approach as “a significant departure from the status quo” in at least three ways: 1) acknowledging that traffic deaths and severe injuries are preventable, 2) setting a time frame for eliminating these preventable deaths and injuries, and 3) intentionally pursuing a multidisciplinary approach not centered on any one type of intervention.
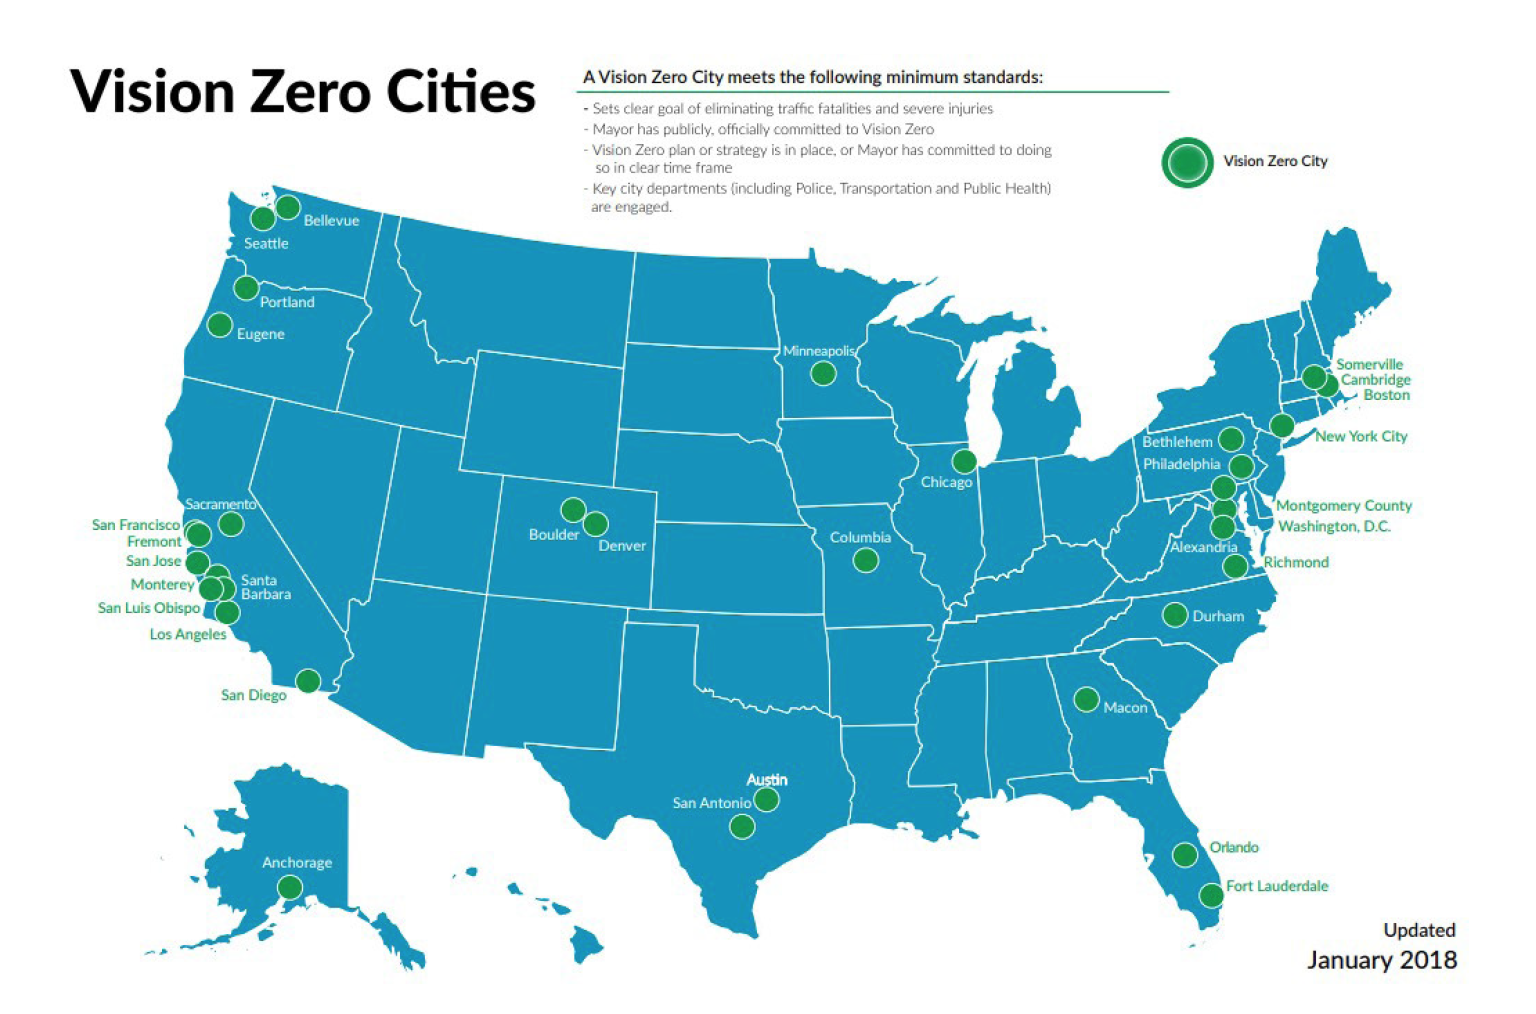
The focus of the Vision Zero Network is on process rather than outcomes, although it is explicitly organized around one outcome. Unlike Toward Zero Deaths, which often discusses individual behavior change, the Vision Zero Network’s five fundamental aspects of a strong Vision Zero commitment include to “prioritize institutional changes rather than individual behavior changes.” The map below shows cities that have met the Vision Zero Network’s minimum standards for action on vision zero.
PRIORITIZING BICYCLIST & PEDESTRIAN SAFETY IN TRAFFIC SAFETY EFFORTS
The Case for Making the Best of Limited Safety Data on Biking & Walking
The Benchmarking Report discusses bicycling and walking safety, not general road safety. Bicycling and walking safety is a lens for general road safety because people who bike and walk are some of the most vulnerable road users, and people who bike and walk generally do not get prominent discussion in traditional road safety reporting, despite the increasing share of fatalities they represent.
Let’s examine three principal metrics for road safety for bicyclists and pedestrians: 1) percentage of traffic fatalities by mode, 2) modal traffic fatalities per 100,000 persons, and 3) modal traffic fatalities per 10,000 commuters. The Benchmarking Report uses the word modal as a general term for mode of transportation and to indicate that a metric could be used for any mode of transportation. Each metric is discussed for slightly different reasons:
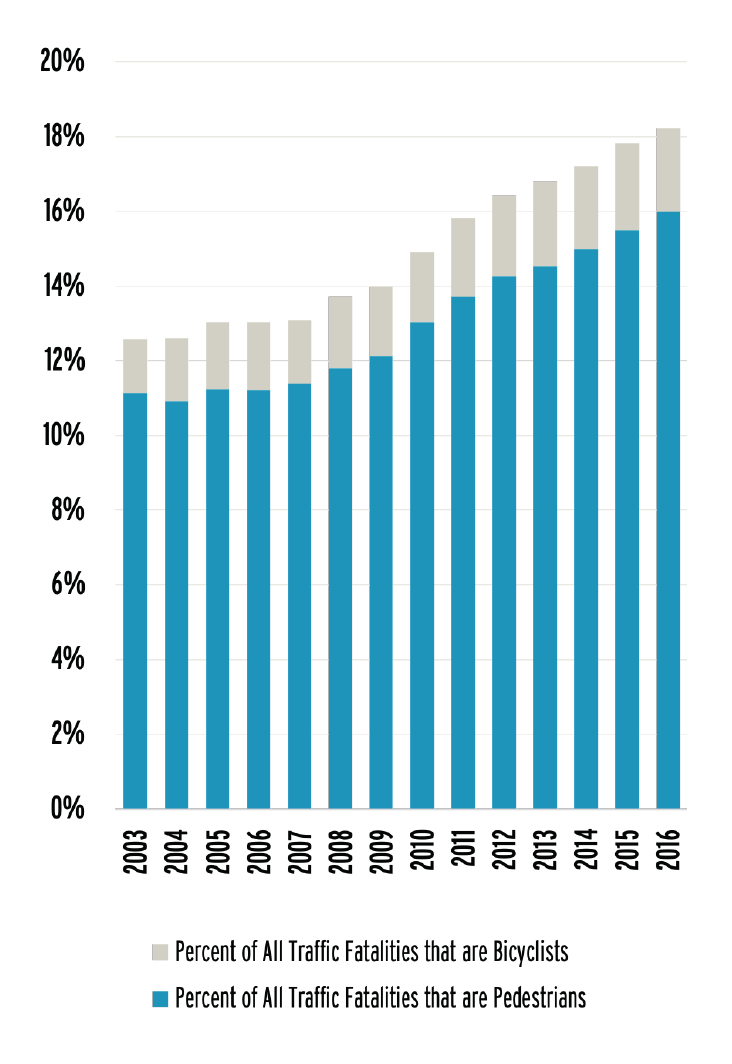
This metric looks at the percentage of traffic fatalities made up of people who used a particular mode of transportation. In recent years, a notable trend has emerged: People who are bicycling and walking represent an increasing percentage of all traffic fatalities.
This increase is primarily due to pedestrian fatalities, although the raw numbers of both bicyclist and pedestrian fatalities have increased in recent years. In 2016, 835 bicyclist fatalities occurred in the United States, the most since 1991, when there were 836 bicyclist fatalities. Similarly, 5,987 pedestrians were killed in 2016, the most since 1990 and its 6,482 pedestrian fatalities.
The Benchmarking Report includes per capita fatality data to allow comparisons among states and communities that have different populations.
Per capita comparisons can be very effective for prompting action. For example, the National Complete Streets Coalition’s “Dangerous by Design” reports have identified communities with high rates of pedestrian fatalities by using a mix of per capita and per commuter data, which built the case for action in communities with ongoing problems.
Per capita data are also very common in public health research. The Centers for Disease Control and Prevention’s Web-based Injury Statistics Query and Reporting System (WISQARS) database includes per capita fatality and serious injury estimates by default.
Expressed per capita, people are much more likely to die in a car crash than as a bicyclist or pedestrian. The rate of pedestrian fatalities per 100,000 persons is approximately 1.8. The rate of bicyclist fatalities per 100,000 persons is approximately 0.26. The rate of traffic fatalities per 100,000 persons for passenger vehicles is 7.6–nearly four times the rate of pedestrian traffic fatalities and more than 28 times the rate of bicyclist traffic fatalities. However, the lack of information on walking and biking in per capita estimates makes interpretation of these risks difficult.
For passenger vehicle travel, safety statistics frequently include a denominator that shows the distance traveled to provide an indicator of how likely a person is to die per mile driven rather than based on a population rate. This is often presented as motor vehicle fatalities per 100 million vehicle miles traveled (VMT). In traffic safety discussions around autos, VMT may be called “exposure” because it quantifies a person’s risk when exposed to a mile of vehicle travel.
VMT is limited when discussing traffic safety in the context of public health because health outcomes can appear to improve as VMT increases, and vehicle driving has inherent risks of its own. For example, in 2008, the rate of fatalities per 100 million VMT was 1.26 (37,423 people died in traffic fatalities). In 2016, the rate was 1.18 (37,461 people died in traffic fatalities). Despite an increase of 38 deaths, an agency or decision maker looking at fatalities per VMT would find a 6% improvement in traffic safety. Regardless, the number of fatalities per VMT is a prominent safety statistic because it helps people understand relative risks when comparing cities, states, or other jurisdictions.
The limited utility of fatalities per VMT was well stated by Frank Haight, the founding editor of the journals Transportation Research and Accident Analysis and Prevention, in a 1985 report: “We do not measure the public health hazard by the fatality rate per distance traveled, a quantity much used in traffic engineering. This ratio is irrelevant to the public health question, just as it might be if we measured lung cancer per quantity of cigarettes consumed, or malaria per mosquito. The similarity is not that mobility and smoking are socially equivalent, but that the vehicle-mile fatality rate, like the per cigarette cancer rate, would confuse cause with effect.”
For biking and walking, no equivalent statistic of vehicle or person miles traveled is readily available at a sub- national level. Roughly once a decade the miles traveled by walking and biking are estimated by the National Household Travel Survey. Recently, several states have undertaken or sponsored research projects to create bicycle and/or pedestrian miles traveled estimates for their states, including Washington and Minnesota. Developing a miles-traveled metric for bicycling and walking is also part of Oregon’s Bicycle and Pedestrian Master Plan.
In the absence of a miles traveled estimate, bicycling and walking commuter (journey to work) data provide a denominator that is useful for highlighting the relative risks of biking and walking in different localities. Use of commuter data has several advantages over use of only the number of pedestrian or bicyclist fatalities, their percentage of all traffic fatalities, or a per capita rate. Most important is that it accounts for differences in the likelihood of people riding or walking in a state or community, which provides additional insights into the relative risks of bicycling and walking between places in the United States. Considerable differences are found in the rates of bicycling and walking among communities throughout the United States, and in some places, these differences have persisted over time. Without using commuter data, those differences could not be accounted for using other nationally available data.
Commuter data also have several limitations, which is why it is not commonly used when discussing passenger vehicle death rates where miles traveled data are available. The biggest limitation is that commuter trips only comprised about 13% of all bicycle trips in 2009 and 20% of all bicycle trips in 2017, according to the National Household Travel Survey.
For pedestrian trips, commuting data are even less representative of actual travel as trips to earn a living were only 6.3% of pedestrian trips in 2009 and 7% in 2017. In this way, commuter data do not provide good insight into total bicycling and walking where trips for other purposes can also vary across localities. Using commuter data also de-emphasizes people who do not commute such as youths, older adults, and people who do not work or who telework.
While commuter data may be used as a way to demonstrate relative risk, it is important that this not lead to bicyclist and pedestrian safety interventions that are only commuter-related.
The Case for Safety in Numbers
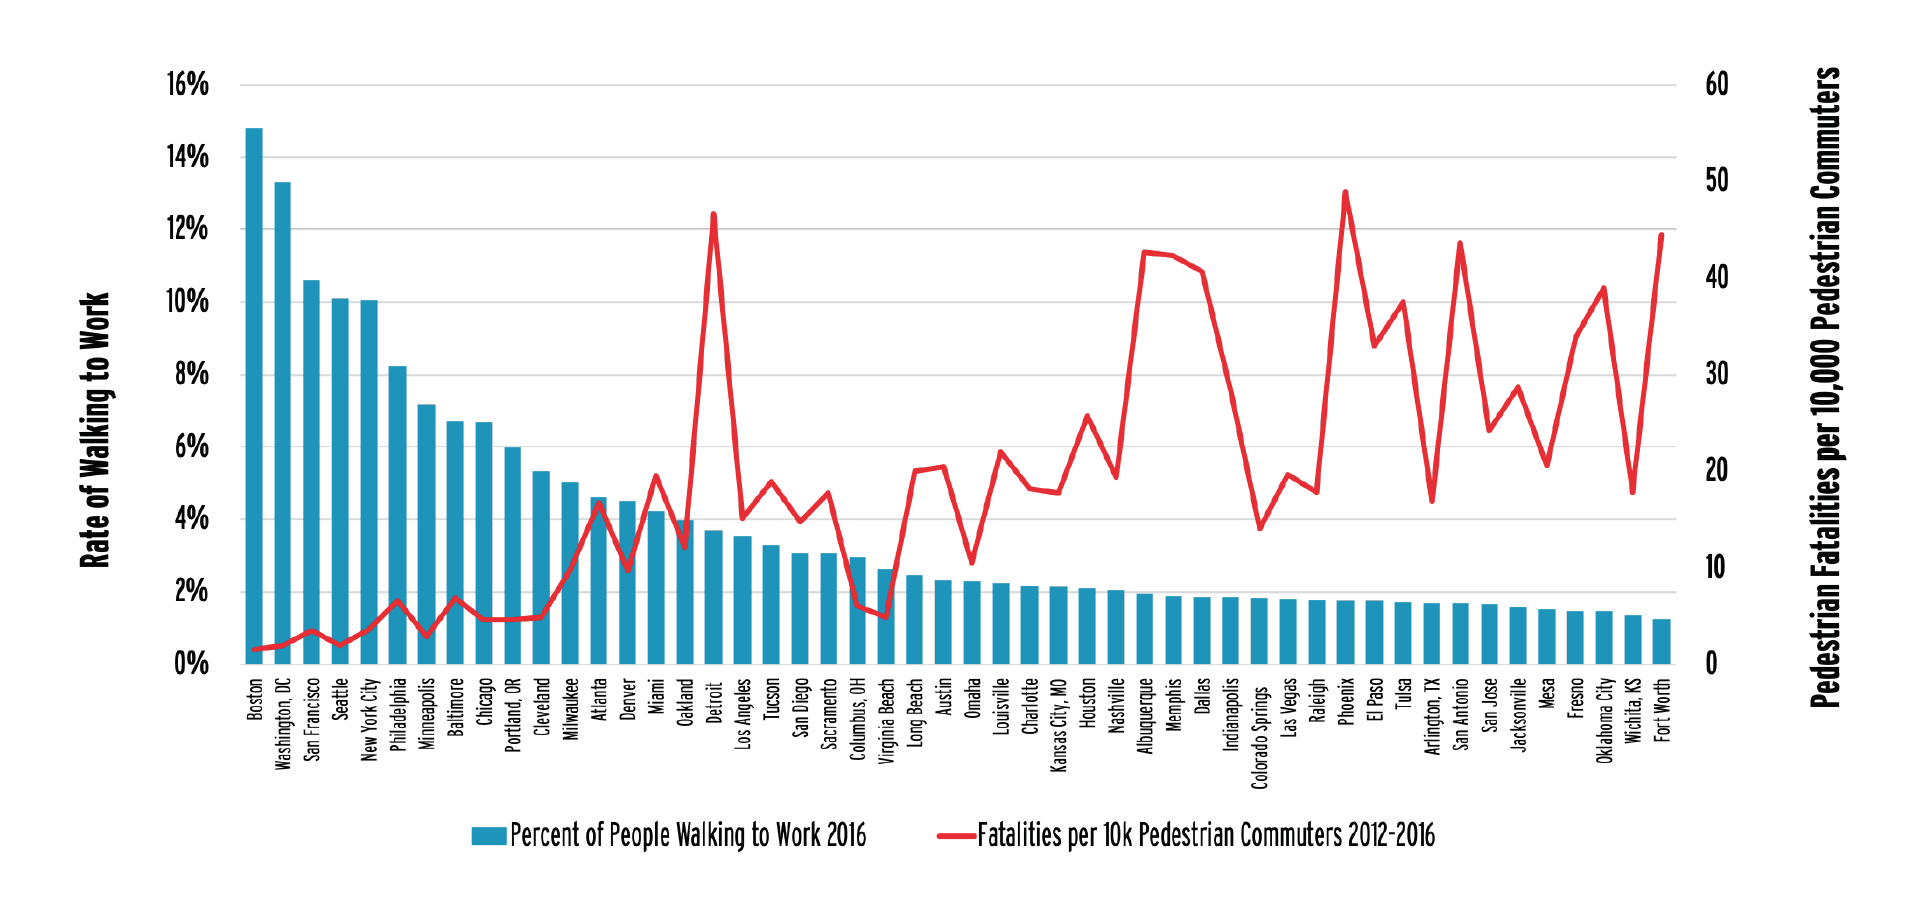
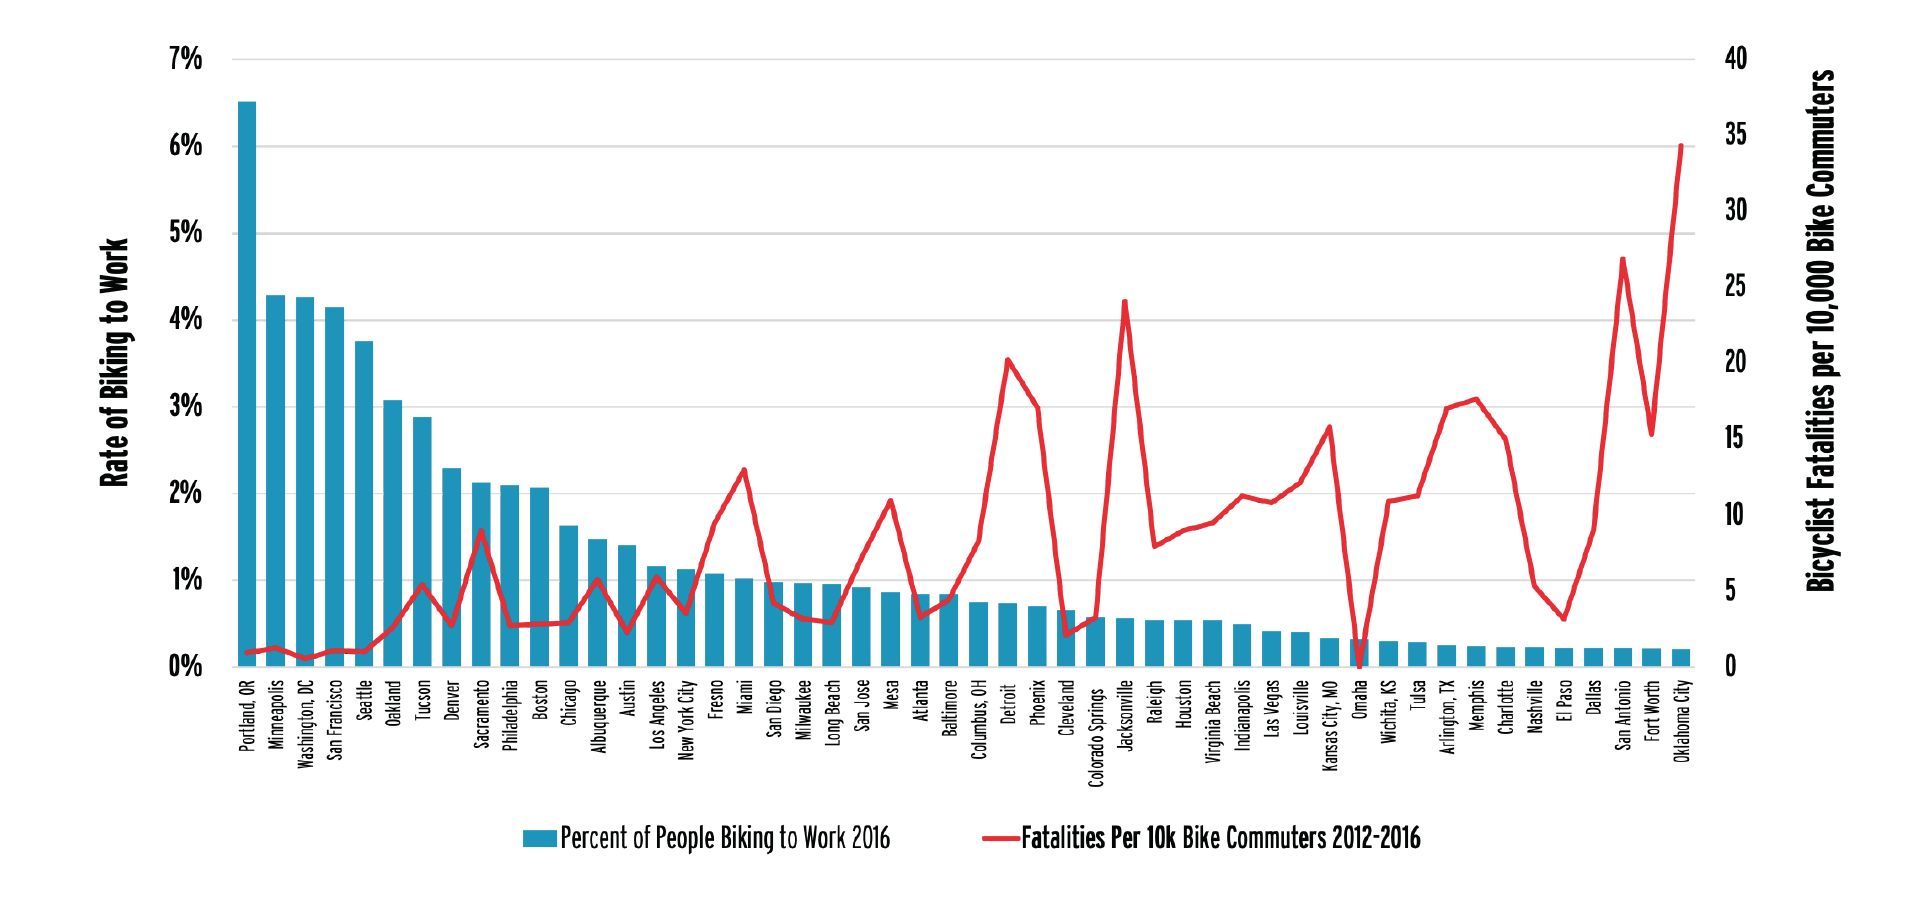
To see how levels of bicycling and walking affect safety, the League of American Bicyclists compared fatality rates in large cities to corresponding bicycle and pedestrian commute mode share. Data for the 50 largest U.S. cities indicates an inverse relationship between bicycling and walking levels and fatality rates.
Cities with the highest rates of pedestrian fatalities are among those with the lowest levels of walking (r = -0.65). Similarly, cities with the highest levels of bicycling generally have lower bicycle fatality rates (r = -0.51). These results are consistent with previous research. A 2016 editorial published in the American Journal of Public Health demonstrated that cities in the United States that grew both their bicycle network and number of bicycle trips had decreased rates of crashes, fatalities, and serious injuries per trip, where data were available.
Safety in numbers has been observed with specificity for pedestrians. One study from Hamilton, Ontario, Canada, found that “drivers seem to expect pedestrians when the pedestrian flow is over 30 pedestrians per hour.” A prior study in Minneapolis also found, “The ‘safety-in-numbers’ effect was indeed observed in both the raw Minneapolis pedestrian and crash data, as well as the modeled data at the broader sample of intersections.” This research may suggest a “dose” at which numbers have a safety effect.
While safety in numbers is an observed reality, researchers have less understanding of why the effect occurs. One explanation is that where more bicyclists and pedestrians are present, motorists are more used to sharing the roadways with bicyclists and are more aware of pedestrians at crossings. One recent study of cities in Norway, Denmark, and Sweden observed a seasonal safety in numbers trend, where seasonal weather – such as cold dark days in these Nordic countries – affects the numbers of people bicycling, suggesting that this general awareness of the likelihood of bicyclist presence has an effect on safety in numbers. However, environmental factors (such as signed routes, bike lanes, and sidewalks) that contribute to increased bicycling and walking likely contribute to increased safety, too. The relative importance of these factors is not yet known.
The Case for Mode Shift as a Traffic Safety Intervention
Places with more biking, walking, and transit tend to be safer for all road users. A shift to modes that have a lower physical capacity for harm such as bicycling and walking may be an effective strategy to reduce road fatalities and serious injuries. Current models of health benefits tend to focus on chronic disease factors associated with physical activity rather than changes in roadway fatalities. Research by the Victoria Transport Policy Institute indicates that “cities where residents average more than 50 annual transit trips have about half the average (per capita) traffic fatality rates as cities where residents average fewer than 20 annual transit trips.” Research on modal shift suggests that it can be accomplished without an increase in the number of bicyclist and pedestrian deaths.
Bicyclists and pedestrians cause fewer deaths than do drivers of motor vehicles. For bicyclists and pedestrians, the reduced potential to cause deaths is based on basic physics– it is nearly impossible for a person bicycling or walking to generate the forces equivalent to crashing the average 4,000-pound motor vehicle.
Many traffic safety efforts do not address the inherent risks of time and distance spent traveling in motor vehicles. As an example, a recent report by the National Governors Association states that the rise in traffic fatalities is due in part to “increased exposure and mobility” but does not identify any strategies that would address that factor, instead focusing on addressing high-risk individual behaviors. Shifting from motorized modes to non-motorized modes could help address this. Indeed, VMT correlates strongly with increased fatality numbers for all users.
Understanding traffic safety as a population-level public health problem is useful for discussing mode shift and is consistent with public health efforts to focus on prevention rather than treatment. A recent article from researchers in Australia argued that “the safety value of reducing average-risk travel has been underestimated.” The value of a population strategy of prevention being necessary where risk is widely diffused through the whole population has similarly been articulated for preventive medicine in general. According to researchers who have adopted a population health perspective, “Optimal reduction in the public health burden attributable to land transport was demonstrated when transport safety risk reduction policies were combined with land use and transport polices that minimized reliance on individual motorized transport and maximized use of active transport modes.”
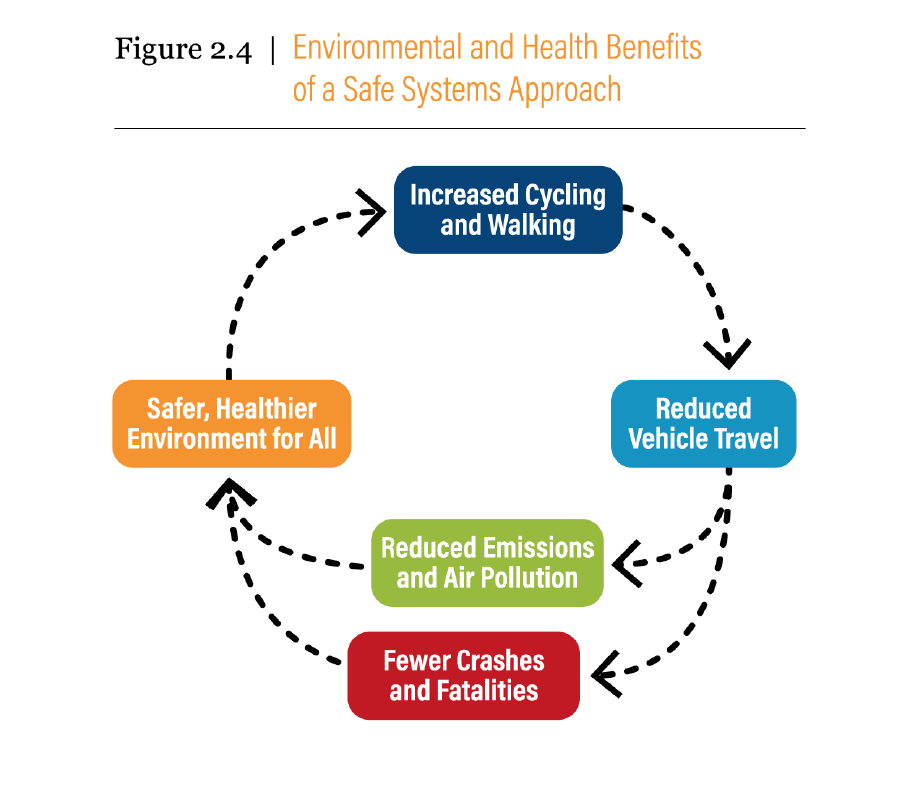
Mode shift is not a specific intervention, since it cannot be done through a single project or through a behavioral intervention. Instead, mode shift relies on a multitude of factors that make bicycling, walking, and transit more acceptable to a population than driving. Mode shift also does not target “unsafe” behaviors but rather seeks to move people from modes of travel with higher inherent risks to modes of travel with lower inherent risks. This is a shift from traditional traffic safety interventions that seek to address roadway designs, high-risk behaviors, or other instances where a lower level of safety is observed relative to a performance standard.
ADVANCING UNDERSTANDING: CURRENT LIMITATIONS ON UNDERSTANDING BICYCLING & WALKING SAFETY
Traffic safety efforts can miss understanding and addressing bicyclist and pedestrian safety needs for a number of reasons, but two issues persist that directly affect most quantitative-based traffic safety efforts.
- THE AMERICAN COMMUNITY SURVEY (ACS) is conducted annually by the Census Bureau and provides data on commuting to work among people aged 16 years or older.
- THE NATIONAL HOUSEHOLD TRAVEL SURVEY (NHTS) is conducted once a decade by the Federal Highway Administration, providing data on all trips.
- THE TRAVEL MONITORING ANALYSIS SYSTEM (TMAS) has ongoing data collection by states on traffic volumes as reported to the Federal Highway Administration. This data collection system is what is currently used to create the Average Annual Daily Traffic (AADT) volume data or vehicle miles traveled (VMT) data used for motor vehicle traffic safety and engineering discussions.
For people who bicycle or walk, VMT has no equivalent denominator. Several attempts are underway to create equivalent measures, however, and the Travel Monitoring Analysis System recently began accepting non-motorized travel data. Since non-motorized travel monitoring is not yet commonplace, people have used the number of bicyclists and pedestrians heading to and from work as a proxy measure to estimate the safety of biking and walking.
The Injury Surveillance Workgroups of the Safe States Alliance recently put out Consensus Recommendations for Pedestrian Injury Surveillance. The 10 recommendations in the report include “Train all primary collectors of pedestrian injury data,” “Include estimates of pedestrian injury exposure so that risk can be calculated,” and “Make pedestrian-specific data collection a routine part of transportation data collection,” while noting “the inability to systematically collect and consistently measure walking exposure (NHTSA, 2013).” The recommendations defined pedestrian exposure as “an observable period or point during which a pedestrian experiences the possibility of suffering an injury related to the act of being a pedestrian.” They suggest five types of exposure data to use: 1) population data, 2) trip count data, 3) travel time/distance data, 4) commute mode share data, and 5) count data.
As an alternative to creating appropriate systems to remedy the lack of national data on bicycling and walking, practitioners can promote bicycle- and pedestrian-related interventions based on more readily available motor vehicle data. An example is the National Association of City Transportation Officials (NACTO)’s “Designing for All Ages and Abilities” guidance, which makes bicycle facility recommendations based on motor vehicle speeds and volumes rather than bicyclist-related data. With this type of guidance, no data on bicycling and walking are needed to recommend facilities for people who bike. However, this type of effort does not address population-level issues with understanding bicycle and pedestrian travel and bicyclist and pedestrian safety.
EMBRACING EQUITY: CURRENT TRAFFIC SAFETY PROBLEMS AS A REFLECTION OF DEMOGRAPHIC DIFFERENCES
Benchmarking data have shown prevalent over-representation of non-white persons and seniors in pedestrian fatalities. People of age 65 or older were overrepresented in pedestrian fatalities in 35 states. Non-white populations were overrepresented in pedestrian fatalities in 30 states. This is consistent with other research that suggests that traffic fatalities reflect demographic differences. A report by Smart Growth America’s National Complete Streets Coalition found that black pedestrians are 60% more likely than white ones to be killed by cars while walking in the United States.
To learn more about the demographics of people killed while walking and biking, please see Chapter IV: Show Your Data.
MAKING THE HEALTH CONNECTION: THE HEALTHCARE COSTS & PREVENTABILITY OF ROAD DEATHS & SERIOUS INJURIES
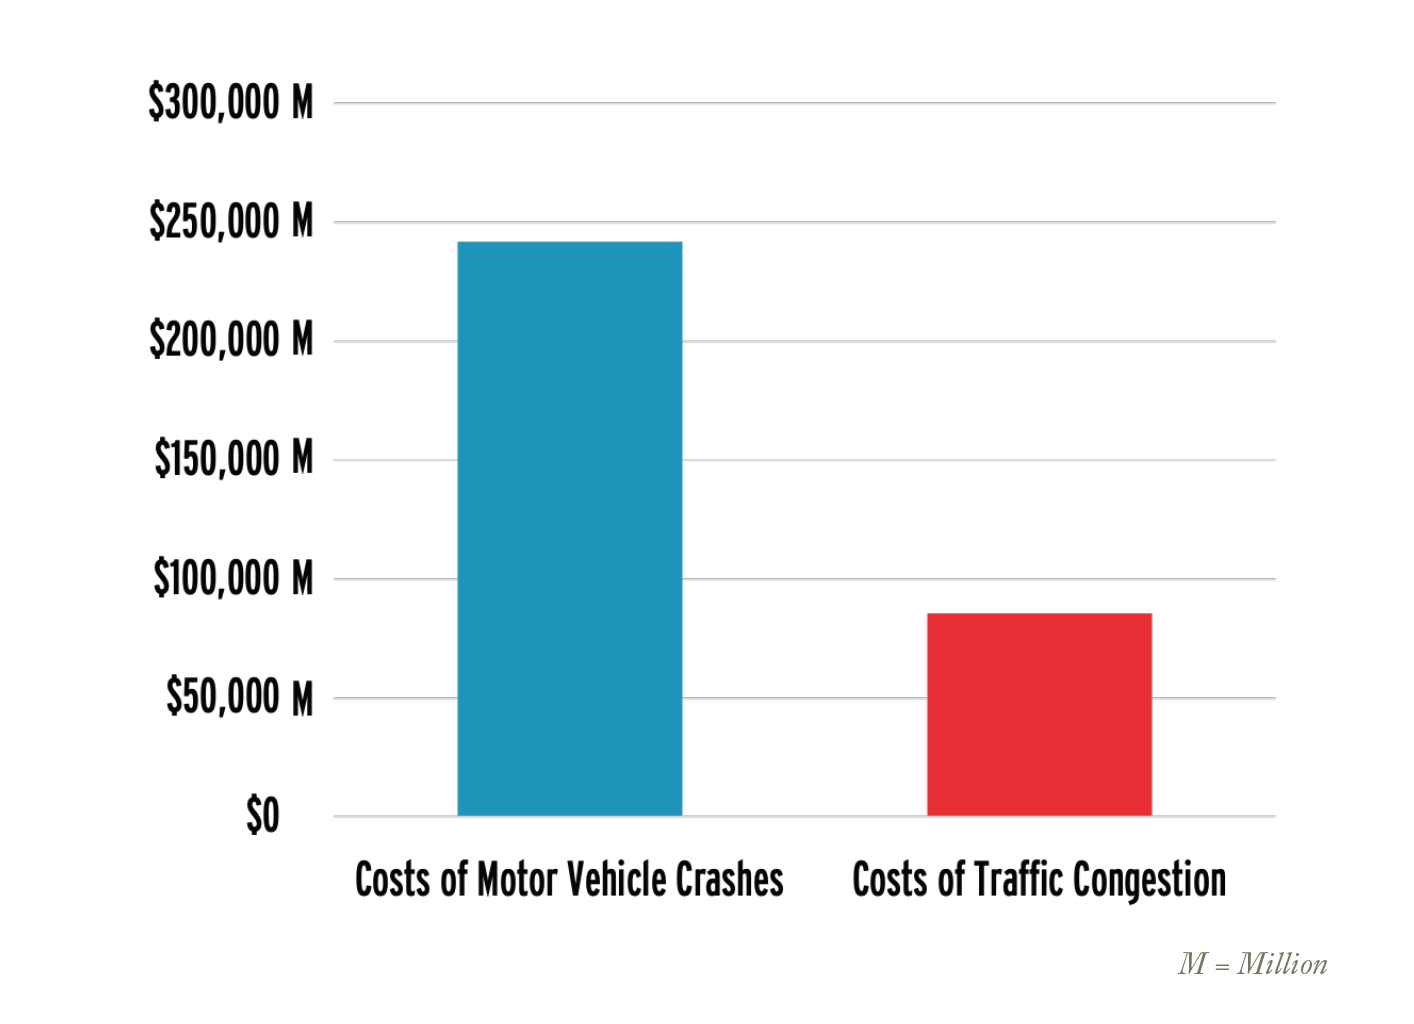
Traffic deaths and serious injuries are health problems leading to both premature death and significant healthcare costs. A 2015 National Highway Traffic Safety Administration (NHTSA) report indicated that motor vehicle crashes in 2010 (a year in which traffic fatalities were more than 4,000 fewer than in 2016) cost society $242 billion or the equivalent of $784 per person (1.6% of 2010 GDP). The report estimated that medical and emergency services related to motor vehicle crashes resulted in approximately $24 billion in costs.
The estimated $242 billion in costs from motor vehicle crashes is nearly three times the estimated costs from congestion, which a 2009 report prepared by HDR, Inc. for the U.S. Department of Transportation estimated at $85.5 billion per year.
Footnote 70
For the federal government, transportation safety has fiscal impacts on Medicare and Medicaid programs. The same 2015 NHTSA report found that an analysis of Medicaid claims and Healthcare Cost and Utilization Project data concluded that “22% of adults ages 19 to 64 with hospital-admitted crash injuries covered by Medicaid (2.85% of all those admitted) became Medicaid-eligible because earnings losses and medical bills resulting from crash injury left them indigent or disabled.” These one-time crash events also made it likely that people would continue to receive care through Medicaid, with an estimated “35% of those who convert to Medicaid to pay hospital bills stay on Medicaid indefinitely. The present value of their lifetime Medicaid health care costs averages $316,000.”